
Innoslate dashboards serve a dual role: they operate as both a high-level command center for real-time analytics and the primary navigation engine for moving through a project's architecture, requirements, and models.
Core Functions & Capabilities
-
Customization: Users can build tailored dashboards to monitor metrics, while project groups can configure project-level metrics centered around specific subsystems, domains, or engineering disciplines.
-
Modular Widget System: Users construct personalized layouts using specialized widgets, such as burndown charts, query results, and activity feeds, to highlight the exact data their role requires.
-
At-a-Glance Project Health: By pulling live data from across the entire system, dashboards display key performance indicators (KPIs), open risks, and verification progress without requiring manual status reports.
-
Central Navigation Hub: Beyond visual reporting, widgets double as interactive entry points; clicking on a metric or status indicator immediately routes users directly to the corresponding artifact or diagram in Innoslate.
By combining real-time progress tracking with hierarchical customization, these dashboards reduce administrative overhead and give both executive leadership and technical teams immediate visibility into project health.
1. Introduction & Core Concepts
Innoslate provides flexible dashboard environments designed to surface actionable insights directly from your underlying project database.
Key Capabilities
-
Real-Time Data Sync: Visualizations and metrics update automatically as underlying entities, relationships, and metadata change.
-
Customizable Layouts: Build tailored views using modular, role-specific widgets.
-
Adaptive Responsive Design: Dashboards automatically adjust layout density based on screen width, automatically reflowing into a clean single-column view on smaller screens, tablets, and mobile devices (v4.14.2).
Types of Dashboards
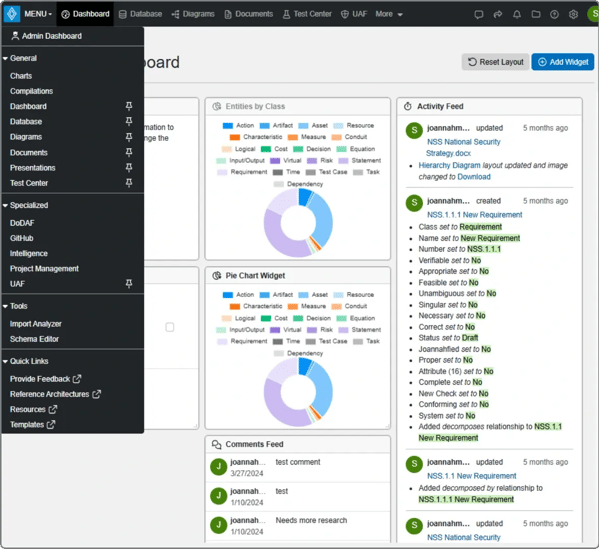
Innoslate provides a versatile suite of dashboard interfaces tailored to streamline your systems engineering workflow. Whether tracking high-level metrics, organizing complex documentation, or leveraging specific enterprise frameworks, these dashboards keep your team aligned and productive.
-
Charts: Transform raw project data into actionable insights like Kanban Boards and Gantt Charts. Easily manage, generate, and review custom data visualizations to identify trends and communicate metrics to stakeholders on your Charts Dashboard.
-
Compilations: Your Dashboard for multi-class documentation. Manage specialized compilation artifacts that pull together any entity class across your database into a single, cohesive Document View.
-
Project Dashboard ('Dashboard'): Your project’s central mission control. Customize a high-level snapshot of overall activity, key performance metrics, recent updates, and quick-access widgets to stay ahead of project risks and progress.
-
Diagrams: The central hub for visual modeling. Access, manage, and collaborate on your entire visual ecosystem, from LML to SysML diagrams, without losing context.
-
Documents: Effortlessly organize, manage, and navigate your entire suite of project requirement documents. Maintain full traceability and version control across requirements, specifications, and reports in a unified workspace.
-
Presentations: Deliver polished, database-driven briefings directly from your engineering data. Build and manage presentations that update in real time as your underlying model evolves.
-
Test Center: Your command center for verification and validation. Plan, track, and execute Test Suites to ensure every system requirement is verified with complete traceability.
Database View is a specialized, raw query view of your underlying project database rather than a traditional dashboard interface.
Specialized
Beyond the general dashboards, Innoslate provides specialized dashboards for particular frameworks, integrations, and views.
-
DoDAF: Simplify defense architecture compliance. Effortlessly generate, view, and manage DoDAF enterprise architecture viewpoints directly from your model data.
-
GitHub: A Dashboard dedicated to managing your GitHub integration.
-
Intelligence: Leverage AI-driven insights to evaluate requirement quality and detect potential system flaws before they become costly.
-
Project Management: Bridge the gap between engineering and project execution. Track tasks, schedules, resources, and project milestones in sync with your system model.
-
UAF: Accelerate complex systems modeling with dedicated tools to create, manage, and maintain Universal Architecture Framework (UAF) products.
Tools
Beyond the general dashboards, Innoslate provides specialized dashboards for particular frameworks, integrations, and views.
- Import Analyzer: Accelerate onboarding and migration. Intelligently ingest, parse, and map external file formats (Word, CSVs) directly into structured Innoslate entities.
-
Schema Editor: A Dashboard dedicated to managing your project's Schema.
2. Navigating and Accessing Dashboards
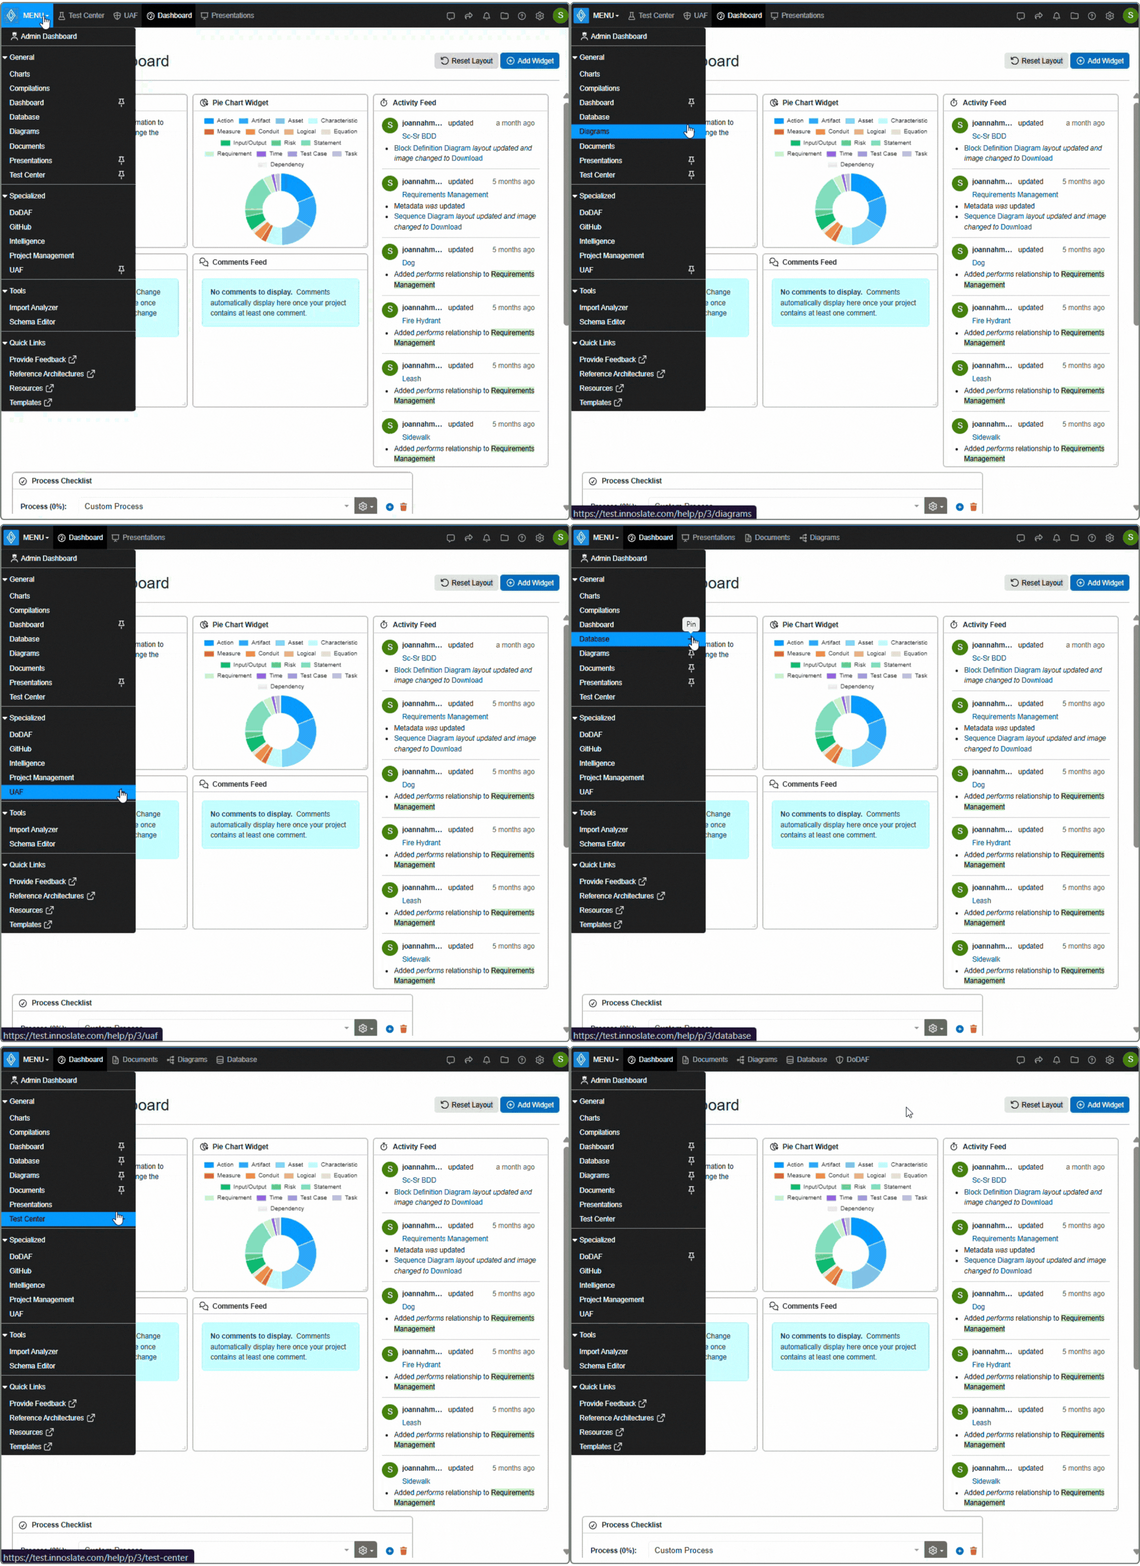
Navigating and Customizing Your Workspace
-
Open the Menu: Locate and click the Navigation Menu (the menu icon) in the top-left corner of the header.
-
Select Your Dashboard: Browse the list and choose the dashboard that fits your current task (such as Documents, Diagrams, or Test Center).
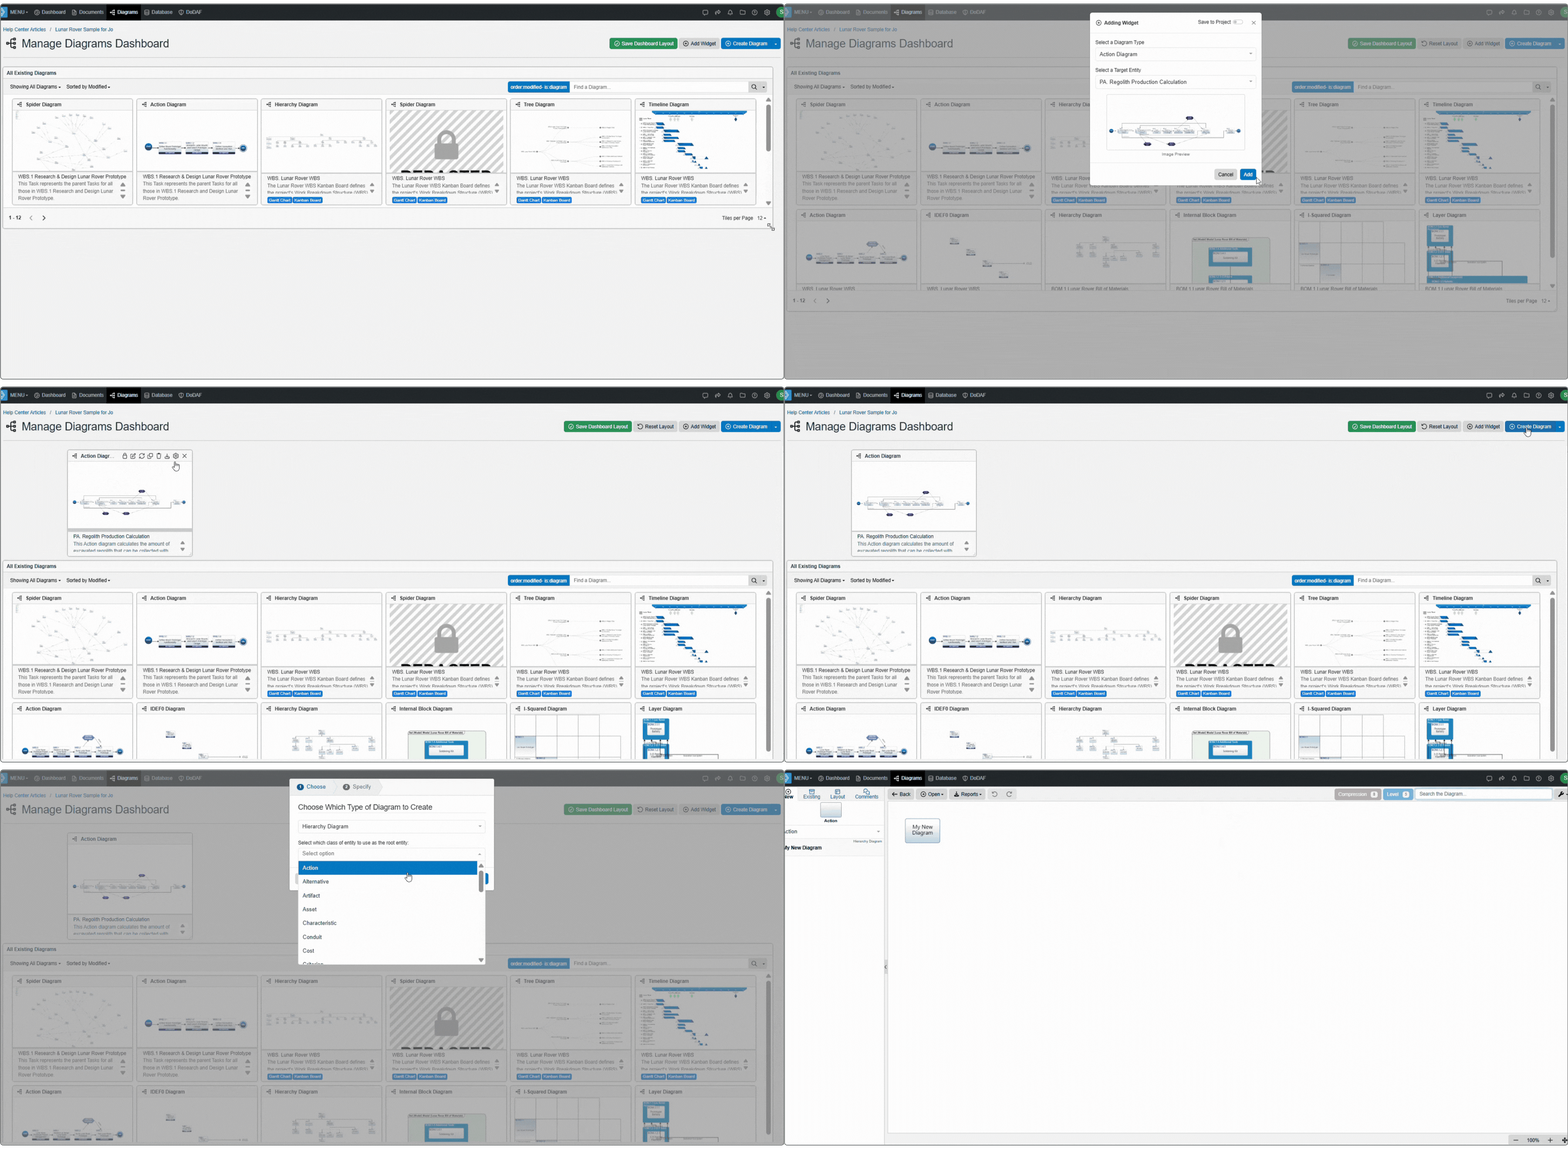
At the top of most Dashboards, you will find standard control options:
-
Widget/ Dashboard Selector: Use the dropdown menu to switch between different available dashboards or widgets.
-
Artifact Creator: Access to creating the corresponding Dashboard's views (i.e., diagrams, documents, charts, compilations, etc.).
-
Edit / Customize Layout: Click to drag, resize, add, or remove widgets.
Pin for Quick Access: To save time, hover over any dashboard you use daily and click the Pin icon. This grounds the dashboard directly onto your top navigation bar for one-click access anywhere in the application.
3. Dashboard Layout & Responsiveness
Dashboards utilize an intuitive grid layout system on desktop screens, allowing widgets to be placed side-by-side or stacked vertically according to screen size.
Dashboards utilize an intuitive grid layout system on desktop screens, allowing widgets to be placed side-by-side or stacked vertically according to preference.
Single-Column Responsive Reflow
When viewing dashboards on smaller screens, tablet displays, or resized browser windows:
-
The dashboard automatically collapses multi-column grids into a single-column layout.
-
Widgets stack vertically in natural order (top-left to bottom-right), ensuring all charts, tables, and comment feeds remain fully legible without requiring horizontal scrolling.
4. Working with Widgets
Widgets are the individual visual modules that make up a dashboard.
Adding and Removing Widgets
-
Open the dashboard you want to modify and click 'Edit.'
-
Click '+ Add Widget' on the top right below the Navigation Menu.
-
Select the desired widget type from the widget dialog.
To remove a widget, hover your cursor over the header of the widget and select 'X'.
Configuring Widget Options
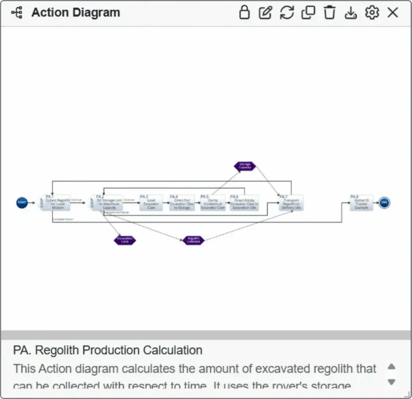
Most widgets offer the following configurable settings:
-
Edit Entity: Customize the Root Entity and name displayed on the widget card.
-
Refresh Image: Update Widget Image.
-
Clone Diagram: Duplicate the Root Entity and its related artifact entities.
-
Delete Diagram: Permanent deletion of Root entity and its related artifact entities.
-
Reports: Download various reports dependent on the artifact type.
-
Edit Widget: Edit the Root Entity Name, Number, or Description.
-
Remove Widget: Remove widget from corresponding Dashboard.
Example Available Widget Types
-
Activity & Social: Activity Feed, Comments Feed Widget, Change Request Widget.
-
Analytics & Traceability: Risk Chart, Traceability Matrix, Spider Diagram.
-
Verification & Testing: Test Cycle Widgets, Test Suite Cards.
-
Entity Management: Entity Table Widget, Query Results Widget.
5. Best Practices
-
Design for User Roles: Create distinct dashboards tailored to specific functions. For example, set up an executive overview dashboard with high-level burn-down charts, and a separate test dashboard for QA engineers with Test Cycle and Test Suite widgets.
-
Leverage Entity Filtering on Project Dashboards: Keep activity widgets clean and context-focused by filtering feed widgets to key system entities rather than displaying project-wide chatter.
-
Optimize for Screen Size: When designing dashboards that will be viewed during meetings or on mobile devices, arrange critical metric widgets near the top left of the grid so they remain prioritized when reflowing to a single column.