
Each Innoslate project has its own ‘Dashboard.’ This Dashboard is the first screen users come across when starting a project. This page is cusotmizable so you can track your project's data in various formats in the form of widgets and cards. By default, you will find the following widgets already added for your convenience:
- Activity Feed
- Bar Chart
- Change Requests
- Chart Card
- Comments Feed
- Compilation Card
- Countdown Clock
- Diagram Card
- Document Card
- DoDAF Card (When DoDAF Schema is applied)
- Entity Table
- Pie Chart Widget
- Process Checklist (v4.12.3)
- Project Wiki Widget
- Presentation Card
- Test Suite Card
- UAF Card (When UAF Schema is applied)
- Wiki Widget
Navigating to Project Dashboard
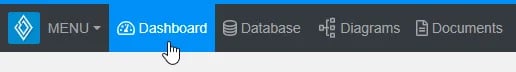
If pinned to the top navigation bar, you can access the ‘Project Dashboard’ directly by clicking the ‘Dashboard’ button on the top navigation bar.
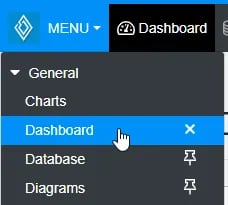
Otherwise, from any view of Innoslate, open the ‘MENU’ drop-down and click the ‘Dashboard’ menu item under the “General” section.
Project Dashboard Widgets
Visit the individual widget pages in the table at the bottom of the page to learn more about how to add, edit, and interact with each widget in the ‘Project Dashboard’.

Available Widgets
| Widget | Description |
|---|---|
| Activity Feed | The ‘Activity Feed’ widget provides a list of your most recent project updates. |
| Bar Chart | The ‘Bar Chart’ widget displays a breakdown of the entities within your project by Class, Label, or Enumeration in the form of a horizontal or vertical bar chart. |
| Change Requests | The 'Change Request' widget provides a list of the most recent Change Requests. |
| Chart Card | The 'Chart Card' (or 'Image Card') widget displays a project-specific chart to visualize key data and metrics as a hyperlink and thumbnail image. |
| Comments Feed | The ‘Comments Feed’ widget displays comments that have been made on any entity within your project. |
| Compilation Card | The ‘Compilation Card’ (or 'Image Card') widget presents a visualization project-specific Compilation as a hyperlink and thumbnail image . |
| Countdown Clock | The 'Countdown Clock' widget shows a countdown to a designated milestone. |
| Diagram Card | The 'Diagram Card' (or 'Image Card') widget shows a project-specific diagram as a hyperlink and thumbnail image. |
| DoDAF Card | The 'DoDAF Card' (or 'Image Card') widget shows a project-specific DoDAF Viewpoint as a hyperlink and thumbnail image. |
| Document Card | The 'Document Card' (or 'Image Card') widget shows a project-specific DoDAF Viewpoint as a hyperlink and thumbnail image. |
| Entity Table | The ‘Entity Table’ widget displays a table of information about the entities in your project, based on a custom search query and user-selected attributes. |
| Pie Chart | The ‘Pie Chart’ widget displays a breakdown of the entities within your project by Class, Label, or Enumeration in the form of a pie/doughnut chart. |
| Presentation Card | The 'Presentation Card' (or 'Image Card') widget shows a project-specific Presentation as a hyperlink and thumbnail image. |
| Process Checklist | The 'Process Checklist' can create or use a built-in a process checklist for each phase of your project. |
| Test Suite Card | The 'Test Suite Card' (or 'Image Card') widget shows a project-specific Test Suite as a hyperlink and thumbnail image. |
| UAF Card | The 'UAF Card' (or 'Image Card') widget shows a project-specific UAFF Viewpoint as a thumbnail image. |
| Wiki | The ‘Wiki’ widget offers a panel to provide useful information to users of the project, including text, pictures, links, tables, and embedded charts and diagrams. There are both a user and project ‘Wiki’. |