
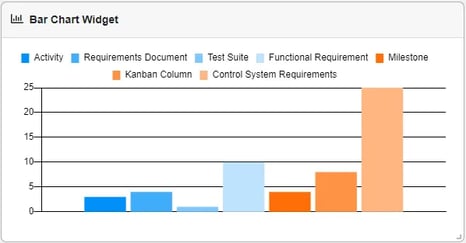
The ‘Bar Chart’ widget displays a breakdown of the entities within your project by Class, Label, or Enumeration in the form of a bar chart.
Adding a ‘Bar Chart’ Widget
1. From your Project Dashboard, click the ‘ Add Widget’ button.

2. The ‘Adding Widget’ modal will appear. Select ‘Bar Chart’.

3. Choose which type of information you want your bar chart to display between either ‘Classes’, ‘Labels’, or ‘Enumeration’. Then choose the specific classes/labels/enumeration you want to show up in the bar chart.

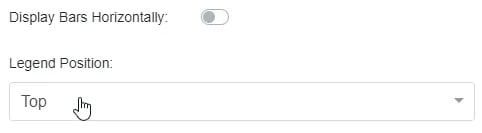
4. Select whether you want to ‘Display Bars Horizontally’ (they are vertical by default) and a ‘Legend Position’ between ‘Top’, ‘Bottom’, ‘Left’, ‘Right’, and ‘None’.
5. Once you have your desired settings, click ‘Add’ to add the widget to the dashboard.

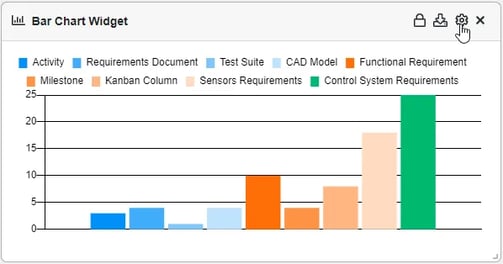
6. This should now display a bar chart of the classes/labels/enumeration you selected if your database contains the appropriate entities. You can edit the ‘Bar Chart’ settings at any time by hovering over the widget and clicking the gear icon.
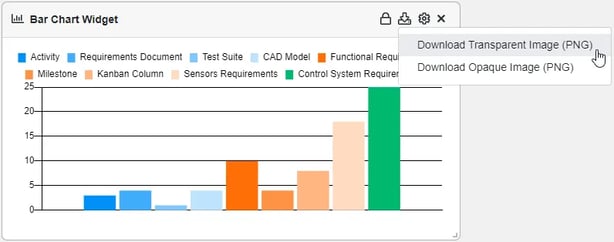
7. You can download images of the current ‘Bar Chart’ by hovering over the widget and clicking the ‘ Download Reports’ icon and then choosing either ‘Transparent Image’ or ‘Opaque Image’.
8. You may also secure its location on the Project Dashboard, via drag and drop, and secure the settings with the 'Lock' icon. Once locked, the settings and close icons will become unavailable after the widget is locked. The widget must be unlocked for these icons to appear again.

9. Lastly, You may close the widget out and bring it back with the 'Add Widget' Function.
continue learning about Chart Widgets, Click Here.
(Next Article: Pie Chart Widget)