
The ‘Pie Chart’ widget displays a breakdown of the entities within your project by Class, Label, or Enumeration in the form of a pie/doughnut chart.

Adding a ‘Pie Chart’ Widget
1. From your Project Dashboard, click the ‘ Add Widget’ button.

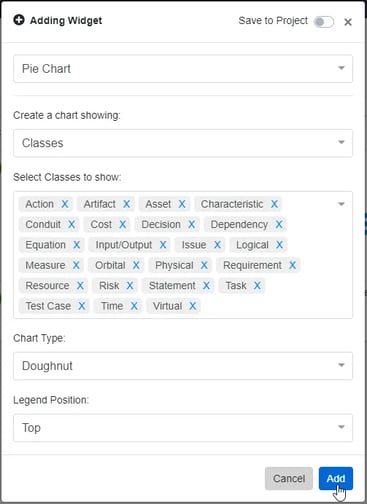
2. The ‘Adding Widget’ modal will appear. Select ‘Pie Chart’.

3. Choose which type of information you want your pie chart to display between either ‘Classes’, ‘Labels’, or ‘Enumeration’. Then choose the specific classes/labels/enumeration you want to show up in the pie chart.

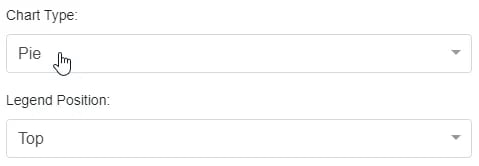
4. Select a ‘Chart Type’ of either ‘Pie’ or ‘Doughnut’ and a ‘Legend Position’ between ‘Top’, ‘Bottom’, ‘Left’, ‘Right’, and ‘None’.
5. Once you have your desired settings, click ‘Add’ to add the widget to the dashboard.
6. This should now display a pie/doughnut chart of the classes/labels/enumeration you selected. You can edit the ‘Pie Chart’ settings at any time by hovering over the widget and clicking the gear icon.
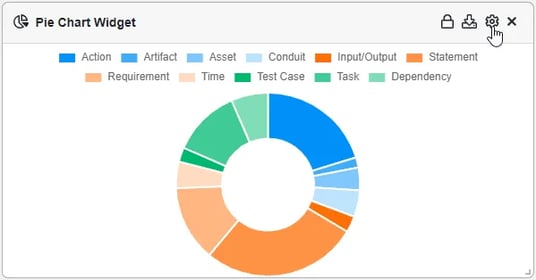
7. You can also download images of the current ‘Pie Chart’ by hovering over the widget and clicking the ‘ Download Reports’ icon and then choosing either ‘Transparent Image’ or ‘Opaque Image’.

8. You may also secure the widget in place on the Dashboard with the lock icon and remove it with X icon.

To continue learning about Chart Widgets, Click Here.
(Next Article: Board Progress Widgets)