Intelligence Dashboard Overview
Leverage the Intelligence Dashboard to improve the quality and analysis of your Innoslate project.
As an Innoslate project grows the process of analyzing it and pinpointing project issues becomes more intricate. In the software domain, many tools exist to maintain performance such as compilers, static code analysis tools, and even automatic graders. Esteemed professors from prestigious research institutions, such as the Naval Postgraduate School and Stevens Institute of Technology, developed structured models of system architecture known as heuristics. These heuristics are integrated into Innoslate through the Intelligence Dashboard feature.
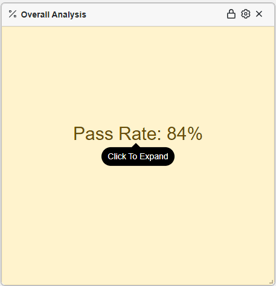
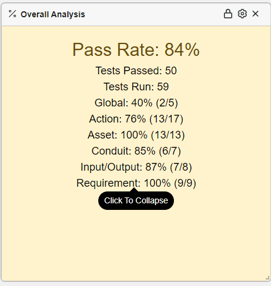
Innoslate's Intelligence Dashboard leverages these heuristics to assess projects in Innoslate and generate a model score across 6 key categories: Action, Asset, Conduit, Input/Output, Requirements, and Global. Each category is scored and labeled by the entity class name, except for Global. A 7th category, the Overall Analysis score, uses all 6 categories scores to provide a comprehensive score 'Pass Rate' of the project.
The Intelligence Dashboard's scoring is determined as a percentage score. The 6 categories are individually determined by the number of successful passes out of the total entity heuristics tested. By combining the tests passed from the 6 categories and dividing by the total tests run, you can calculate the Overall Analysis 'Pass Rate' Score for your Innoslate project.
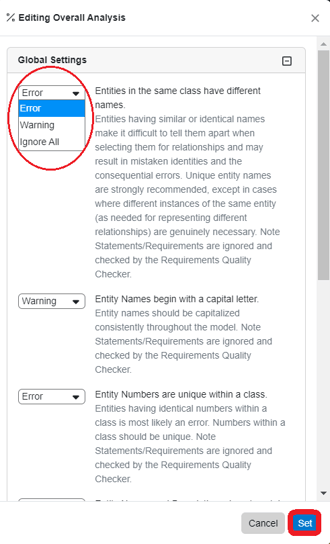
Within the Intelligence Tool, you have the option to customize the 'settings' (heuristics) to tailor the analysis to your specific needs. Whether it's adjusting Global settings, Action settings, Asset settings, Conduit settings, Input/Output settings, or Requirement settings, you have the flexibility to fine-tune the analysis to meet your project's specific requirements.
Each heuristic in the Intelligence Dashboard serves a specific purpose, such as ensuring consistency in entity names, verifying that actions have proper naming conventions, and confirming that each action is associated with the necessary inputs and outputs. By following these guidelines, you can enhance the clarity and effectiveness of your model.
Overall, the Intelligence Dashboard is a valuable tool for optimizing the quality of your project and streamlining the modeling process. By utilizing the insights and recommendations provided, you can improve the accuracy and efficiency of your Innoslate project.
Navigating to the Intelligence Dashboard
- From within a project, open the ‘MENU’ drop-down and click the ‘Intelligence’ menu item under the 'Specialized' section.

- Once in the ‘Intelligence Dashboard’, the analysis will automatically run the first time you open the view. After model changes, you may rerun the analysis by selecting the ‘Run’ button again.
Intelligence Dashboard Overview

Upon opening the ‘Intelligence Dashboard’ and the initial analysis finalizes, the Dashboard opens and will display feature buttons on the top right and the Intelligence Dashboard to display the Widgets. Let's explore these in more detail below.
Feature Buttons

The buttons provided are:
'Help' -to direct you to this Help Center page
'Run' to rerun the Intelligence Analysis (to update the scores, especially helpful if project changes have happened)
'Save Dashboard Layout' will appear when changes are made to the Intelligence Dashboard. Select 'Save' when you'd like to save your desired layout.
'Add Widget' to add a widget back on to the Intelligence Dashboard.
Intelligence Dashboard Widgets
The Intelligence Dashboard presents all available widgets by default, allowing users to easily drag, drop, resize or close them according to their preferences.
The widgets on the Intelligence Dashboard available are:
- Overall Analysis
- Global Analysis
- Action Analysis
- Asset Analysis
- Conduit Analysis
- Input/Output Analysis
- Requirement Analysis
- Bar Analysis
Overall Analysis Widget


Global Analysis, Action Analysis, Asset Analysis, Conduit Analysis, Input/Output Analysis & Requirement Analysis Widgets


Issues
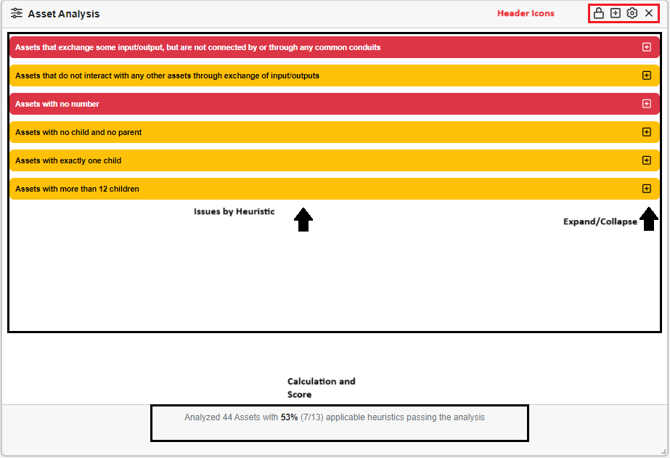
During the analysis, if an entity fails to meet the heuristic the heuristic will appear as either an error (red) or a warning (yellow). By default, the heuristics' list of issues are collapsed, allowing you to expand the individual heuristics to identify the entity/entities that require attention. To see all, use 'Maximize' in the widget header.
When hovering your cursor over the expand/collapse buttons the amount of entities with issues will display in the form of a tooltip for each heuristic. Upon expanding the entities, the Intelligence Dashboard provides the options to either 'Fix' the issue promptly or 'Ignore' it. You may also right click on the entity to fix the issue in Entity View.
Depending on the specific heuristic, the process of fixing an entity may vary, often requiring you to determine the appropriate solution through a window. When an entity is fixed, a 'Fixed Markings' popup will appear in the widget to inform you fixed entities are marked in gray and that the analysis needs to be re-ran with the 'Run' button on the top of the Dashboard to get a new score.
When 'Ignore' is selected, the entity will dissapear from the list. The first time 'Ignore' is selected, the 'Unignore All' Icon will appear on the widget's toolbar.
Calculation and Score
Per Category, the calculation is determined by the number of successful passes out of the total entities the heuristics analyzed. For example, there are 388 entities in a project and there are 5 heuristics in the Global Analysis, so we multiply 388 x 5=1940. After the analysis is ran, 387 issues were found in total among the 5 heuristics in the Global Analysis. The score is therefore calculated as 387/1940 = 20% (rounded up from .199).
The Overall Analysis 'Pass Rate' is calculated by dividing the number of Tests Passed by the total number of Tests Run (knowing how this calculation works can be especially useful when certain categories and heuristics are not conducted).
Bar Analysis Widget


