
Using Tree Diagrams
| Function | Description |
|---|---|
| Creating Tree Diagrams | You can ‘Create a Tree Diagram’ with up to five levels of decomposition of entities top-down. |
| Viewing Tree Diagrams | You can ‘View a Tree Diagram’ of any new or existing entity of any class via the ‘Open’ drop-down menu, where available. |
| Tree Diagram Constructs | Overview of the constructs in the Tree Diagram. |
| Adding an Entity | An entity can be added to a Tree Diagram via drag-and-drop. |
| Hide/Show Branches | How to hide/show branches in your Tree Diagram. |
| Removing an Entity | An entity can be easily removed from a ‘Tree Diagram.’ |
The ‘Tree Diagram’ is a type of hierarchical organizational chart used in Innoslate as a means of visualizing levels of decomposition horizontally.

The ‘Tree Diagram’ is composed of special diagram constructs of any class. In fact, a ‘Tree Diagram’ can be generated by Innoslate on the fly based on the current contents of your project’s database. The ‘Tree Diagram’ is built using entities in the database of any specific class and their decomposed by/decomposes relationships. The entities display as nodes with labels containing the number and name of the entity and their decomposed by/decomposes relationships create the hierarchical structure displayed as curved lines.
Creating Tree Diagrams
Within the ‘Diagrams Dashboard,’ users can create a new diagram by clicking the ‘ Create Diagram’ button in the top right corner of the page.

Clicking the ‘Create Diagram’ button will open the Create Diagram dialog where you will be directed through the process of creating a new diagram.
Create a Tree Diagram
- Choose Which Type of Diagram to Create
In step 1, select ‘Tree Diagram,’ under ‘General,’ as your diagram type.

Select which class of entity to use as the root entity.

Click the ‘Next’ button.

- Specify New Root Action Information
In step 2, you will be prompted to input a diagram ‘Name,’ ‘Number’ (optional), and ‘Description’ (optional). Then, click the ‘Finish’ button to save and automatically open your new Tree Diagram.

Viewing Tree Diagrams
In Innoslate, you can view a ‘Tree Diagram’ from wherever the ‘Open’ drop-down menu is available on the toolbar (Entity View, Database View, within a Document, within a Diagram, within a Test Suite).
View a Tree Diagram
-
Locate and click the ‘Open’ drop-down menu in the toolbar. Select ‘Tree Diagram.’

-
This will navigate you to view a ‘Tree Diagram,’ where you can begin adding and removing entities. Click the ‘Save’ button located on the toolbar to persist your changes to your project’s database.

Tree Diagram Constructs
Node
A Node represents an entity in the hierarchy. This is the only construct able to be selected from the left side bar.
Parent Node
![]()
In the Tree Diagram View, when a Node becomes a parent, the Node will change and automatically change to a gray node. In the diagram canvas, this indicates it can be selected to display its children.
Branch

The Branch construct in the Tree Diagram represents the connection between two entities, visually indicating the relationship and hierarchy between them. Branches in the diagram show how entities are linked and decomposed, providing a clear, organized and horizontal representation of the hierarchical structure.
Add an Entity
-
In the 'Tree Diagram,' select the new entity's class from the dropdown menu in the 'New' tab of the left sidebar. The available classes will depend on the diagram's Root Entity and the Project's schema. The node's class description will change when you select it:
- Once you have selected the node, you can drag it onto the diagram canvas by holding down the left mouse button and release the button to add the new entity. To add the new entity as a child to the diagram, make sure to drag the node over the desired entity's node until it changes color to green, as illustrated below.
-
Once the node is dropped in the canvas, the sidebar will automatically switch to display the 'Metadata,' 'Attributes,' and 'Relationships' tabs. Enter a descriptive name for your new action in the 'Attributes' tab on the left sidebar (autofocused in the software for convenience).

- Click the ‘Save’ button located on the toolbar to persist your changes to your project’s database.

Hide/Show Tree Branches
Users can hide/show deeper levels by selecting the filled grayed node to display the next branch level and selecting the parent node again will hide the level.
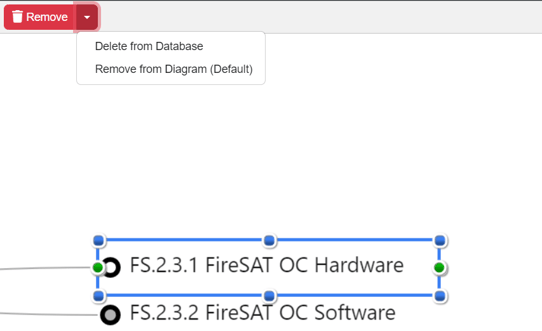
Removing an Entity
An entity can be easily removed from a ‘Tree Diagram.’
- Within a ‘Tree Diagram,’ select the node you wish to remove. This will make the toolbar appear with applicable functions which can be used on the selected entity.
- Click the ‘Remove’ button to remove the entity from the diagram (as the default action). The ‘Remove’ button also includes a drop-down, as indicated with an arrow, where you can select ‘Delete from Database’ or the default option of ‘Remove from Diagram.’
Tutorial Video
To continue learning about General Diagrams, Click Here.
(Next Article: Tree Diagram Modifications & Settings)