
| Traceability Matrix View Overview |
| Create a Traceability Matrix |
| Create a Traceability Matrix from a View |
| Save a Traceability Matrix |
Innoslate provides a robust tool called the 'Traceability Matrix,' enabling users to chart relationships among entities. This interactive matrix view showcases entities on both the X and Y axes, simplifying the process of establishing traceability.
Note: The capability to save a Traceability Matrix is accessible in v4.9 and up. Earlier versions do not have the functionality to save the Matrix.
Traceability Matrix Overview

There are 3 main areas to provide users areas to interact with a Traceability Matrix:
- Left Sidebar- The left sidebar provides users a visual indicator of the Y-axis, options to change the X-axis entities, relationship type and modify the Root Artifact Entity. When hovering a cursor over a cell, the left sidebar will also show the entities on the X- and Y- axis that intersect at the hovered position.
- Matrix- Users can utilize the Matrix section to create relationships between the entities that intersect at a specific cell.
- Toolbar- Provdes users tools and features to save, create reports, hide or add columns, etc.
Left Sidebar

The left sidebar provides users a visual indication of the Left Query (Y Axis), a way to change the Top (X-axis) entities and relationship type, and modify the Root Artifact Entity (if saved).
Notice the second tab 'Comments' and the Matrix Artifact indicator. These will appear for modification when the Traceability Matrix is saved to an Artifact entity(v4.9).
When hovering a cursor over a cell in the Matrix, the left sidebar will identify the entities on the X- and Y- axis that intersect at the hovered position.

Lastly, note the left sidebar will change and reflect an entity's Metadata, Attributes and Relationships Tabs when a specific entity along the X- or Y- axis is selected.

Matrix
 The Matrix is composed of Rows, Columns, and Grid Cells, with each section contributing to the overall structure of the Matrix. Users establish traceability among entities by creating relationships between the entities that intersect at each specific cell within the Grid Cells. The Rows represent the Y-axis entities, while the Columns depict the entities on the X-axis.
The Matrix area serves purposes such as creating relationships between entities, searching and navigating through the Matrix and selecting specific entities to edit them with the left sidebar.
- Rows (Left)- The Y-axis displays rows of entities based on user input.
- Columns (Top)- The X-axis displays entities in a column format based on user input.
- Grid Cells- Create and modify relationships by selecting the intersecting cell where rows and columns meet on the grid.
Toggling a Relationship
To toggle a relationship, click the box which represents the intersection between the two entities you would like to relate. If the box does not already have an “X” and it is clicked on, a new 'X' will appear indicating a new relationship will be created between the entities. If the box already has an “X” and it is clicked on again, the relationship will be removed between the two entities.
Note, all changes made to the Matrix will be queued until the matrix is saved. The matrix will be saved automatically when leaving the view or clicking the ‘Save’ button. To discard unwanted changes, click the arrow next to the ‘Save’ button and select the ‘Discard Changes’ menu item.
Paging the Matrix
Matrices utilize a paging system when large hierarchies of entities are to be displayed. This enables extremely large matrices to be displayed without major performance penalties. Click the right scrollbar to navigate up and down the y-axis entities. Or click the bottom scrollbar to go left and right along the x-axis.

Toolbar
![]()
The toolbar provides users with additional tools to help them navigate and utilize features within their Traceability Matrix, which we will further explore below.
'Back' will navigate the user to their previous view prior to navigating to the Traceability Matrix view.
'Add Column' allows users to select add specific entities to the Column space.
'Import' allows for CSV importing from the Importable Report Output (available in Reports).
'Reports' allows to export the Traceability Matrix to the following formats:- Matrix Report (XLSX)
- Comma Separated (CSV)
- Importable Matrix (CSV)
These settings and the wrench icon (the Settings Menu) are explained in more detail at this page.
Create a Traceability Matrix
To create a Traceability Matrix, simply follow these steps. The steps below apply to v4.9:
1) Navigate to Database View.
2) Create an Artifact entity.
2) Assign the 'Matrix' label on the left sidebar.
3) Give the Matrix a Number (mandatory) and Name (optional).
4) Click 'Open' and select Traceability Matrix.
5a) Innoslate will navigate to the Traceability Matrix where the 'Missing Matrix' window will appear.
5b) Select your preferred method to access Y-axis entities, 'Query' or Root 'Entity' from the dropdown menu.

If choosing by Query, the window will display the Query field so users may enter their desired Query:

Or Entity will provide a dropdown so users may select (or type) their desired Root Entity (or select the gray icon gear to bring in a Root Entity from another project):

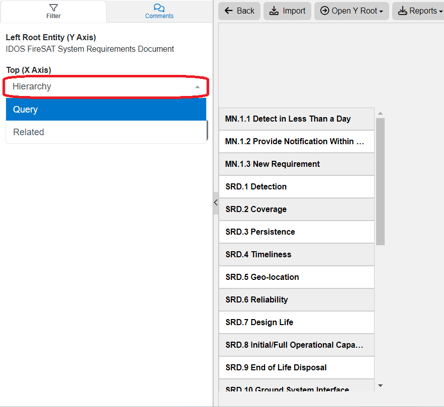
6) On the left sidebar, select the X-axis via Hierarchy, Query or Related.

- Hierarchy (Default)
The Hierarchy fetch option will display parents of hierarchies to display on the Top X Axis. Users may bring in parents of hierarchies from other projects wth the gear icon that appears with this option.
- Query
The Query fetch option will display the results of a search query when typed into the field.
- Related
The Related fetch option will fetch all related entities based on the selected relationship.
7) (optional) If Query or Hierarchy is selected in step 6, users will then want to select the Relationship deisred in the dropdown that appears (or type in the field to pull it up).

8) The Traceability Matrix View will then be completed for users to create relationships among the entities displayed in the matrix. Select 'Save' on the toolbar.
9) Navigate to Charts Dashboard and find the newly created Traceability Matrix.
See these steps in action with the video below:
Creating a Traceability Matrix from another view
Users may also create a Traceability Matrix on the fly with the entities displayed in their current view, such as Database View or Documents View. To accomplish this, simply follow the steps outlined below:
1) Select, create or open to the view to start the Y-axis, or rows of entities.
2) Click on the 'Open' dropdown from this view. These entities will be displayed on the Y axis (Note, Database View has a 'Matrix' option in the toolbar). Note, from a diagram or document if you select a specific entity and open the Traceability Matrix, it will only show that entity and its children.

3) The Traceability Matrix will open up so users may then select the X-axis entites from the left sidebar with the following options:
- Hierarchy (Default)
The Hierarchy fetch option will display parents of hierarchies to display on the Top X Axis. Users may bring in parents of hierarchies from other projects wth the gear icon that appears with this option.
- Query
The Query fetch option will display the results of a search query when typed into the field.
- Related
The Related fetch option will fetch all related entities based on the selected relationship.
Save a Traceability Matrix
1) Once the Traceability Matrix is ready to be saved and referenced later, use the 'Export to Artifact' option on the top toolbar.

2) A prompt for a new artifact will appear. Enter a Name or Number for the new artifact, Description is optional.

3) Select 'Export.'

4) Innoslate will direct users to the new Artifact's Entity View. Users may use the 'Open' dropdown to access the Matrix.
 5) The Traceability Matrix can be accessed via the Charts Dashboard. Access the Charts Dashboard from the Menu Dropdown on the top left of the Navigation Bar:

6) The Traceability Matrix will be available on the Charts Dashboard.

Tutorial Video
To continue learning about the Traceability Matrix, Click Here.
(Next Article: Traceability Matrix Features & Settings)