
Using Timeline Diagrams
| Function | Description |
|---|---|
| Creating Timeline Diagrams | Using ‘Diagrams Dashboard’ in Innoslate, you can create a new ‘Timeline Diagram.’ |
| Viewing Timeline Diagrams | You can ‘View a Timeline Diagram’ of any new or existing entity of the Action class via the ‘Open’ drop-down menu, where available. |
| Adding an Entity | An entity can be added to a ‘Timeline Diagram’ via drag-and-drop. |
| Create Dependencies | How to create dependencies between action entities. |
| Removing an Entity | An entity can be easily removed from a ‘Timeline Diagram.’ |

The ‘Timeline Diagram’ is used to visualize the linear order of actions and milestones within a window of time. This diagram is capable of displaying up to ten levels of decomposition of actions (or action subclasses).
The ‘Timeline Diagram’ is composed of special 'Action' and Action subclass constructs. In fact, a ‘Timeline Diagram’ can be generated by Innoslate on the fly based on the current contents of your project’s database. The ‘Timeline Diagram’ is built using entities in the database of the ‘Action’ class and its subclasses. The actions display as timeline event blocks within the timescale grid.
Creating Timeline Diagrams
Within the ‘Diagrams Dashboard,’ users can create a new diagram by clicking the ‘ Create Diagram’ button in the top right corner of the page.

Clicking the ‘Create Diagram’ button will open the New Diagram dialog where you will be directed through the process of creating a new diagram.
Create a Timeline Diagram
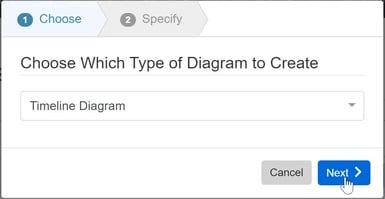
- Choose Which Type of Diagram to Create
In step 1, select ‘Timeline Diagram,’ under ‘General,’ as your diagram type.
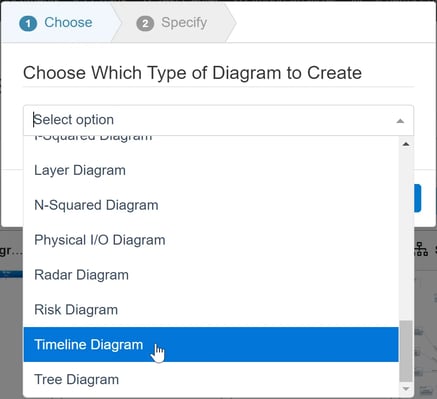
Click the ‘Next’ button.
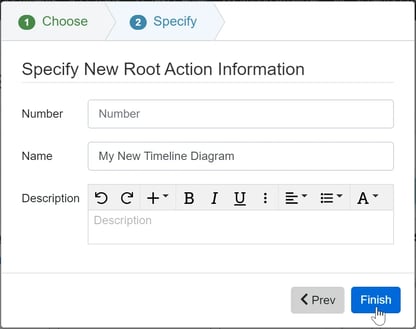
- Specify New Root Action Information
In step 2, you will be prompted to input a diagram ‘Name,’ ‘Number’ (optional), and ‘Description’ (optional). Then, click the ‘Finish’ button to save and automatically open your new Timeline Diagram.
Viewing Timeline Diagrams
In Innoslate, you can view a ‘Timeline Diagram’ from wherever the ‘Open’ drop-down menu is available on the toolbar (Entity View, Database View, within a Diagram).
View a Timeline Diagram
- Locate and click the ‘Open’ drop-down menu in the toolbar. Select ‘Timeline Diagram.’

- This will navigate you to view a ‘Timeline Diagram,’ where you can begin adding and removing entities. Click the ‘Save’ button located on the toolbar to persist your changes to your project’s database.

Adding an Entity
An entity can be added to a ‘Timeline Diagram’ via drag-and-drop.
Adding a Timeline Action
- Within a ‘Timeline Diagram,’ ensure you do not currently have an ‘Action’ selected, and click the ‘Timeline’ icon in the ‘New’ tab of the left sidebar and continue to hold down the left mouse button.

- Drag the ‘Action’ timeline block over to the adjacent diagram canvas. Release the left mouse button while over the diagram canvas to the desired start time to drop the new ‘Timeline’ Action and add it to the diagram.
Notice the ‘Timeline’ Action stays selected once it has been dropped. Since it is selected, the toolbar changes to include buttons for functions that can be used on the construct. The sidebar also changes to show the ‘Metadata,’ ‘Attributes’ and ‘Relationships’ tabs.

- Enter a meaningful name for your new ‘Timeline’ Action via the ‘Attributes’ tab of the left sidebar (focused automatically for convenience).

- You can easily change an Action’s duration by clicking the Action shape and then clicking and dragging the blue circle on the right side of the Action. Or by sliding the entire scale left to right. Note, when doing this the start and end dates are indicated on the bottom of the toolbar frame as displayed in the video below. This will also change the start date attribute automatically on the left sidebar.
- Click outside of the entity and then click the ‘Save’ button located on the top of the toolbar to persist your changes to your diagram.

Users may also organize the order of their actions on the diagram with the up/down cursors next to the entity names.
Adding a Milestone
- Within a ‘Timeline Diagram,’ ensure you do not currently have an ‘Action’ selected, and click the ‘Milestone’ diamond icon in the ‘New’ tab of the left sidebar and continue to hold down the left mouse button.

- Drag the ‘Milestone’ diamond over to the adjacent diagram canvas.

Notice the date on the bottom of the tollbar frame reflects the Milestone's location on the timescale when dragging it across the canvas. - Release the left mouse button while over the diagram canvas to the desired start time to drop the new ‘Milestone’ diamond and add it to the diagram.
Notice the ‘Timeline’ Action stays selected once it has been dropped. Since it is selected, the toolbar changes to include buttons for functions that can be used on the construct. The sidebar also changes to show the ‘Metadata,’ ‘Attributes’ and ‘Relationships’ tabs. The Start attribute for the Milestone will reflect the date it is located on the canvas.

- Enter a meaningful name for your new ‘Milestone’ via the ‘Attributes’ tab of the left sidebar (focused automatically for convenience).

- Click outside of the entities on the canvas and select the ‘Save’ button located on the toolbar to persist your changes to your project’s database.

* Note: The above process describes using the ‘New’ tab of the left sidebar, which automatically generates a new entity to represent each new block. If you would like to reuse existing entities from your database in your diagram, use the ‘Existing’ tab instead.
Creating Dependencies
When users select the timeline indicator constructs, green dots appear for users to create dependency relationships amongst them. Users may select the green dot and a line will appear to drop the line to the desired action to create the dependency relationship.
The video below will show this in action.
Removing an Entity
An entity can be easily removed from a ‘Timeline Diagram.’
- Within a ‘Timeline Diagram,’ select the entity you wish to remove. This will make the toolbar appear with applicable functions which can be used on the selected entity.
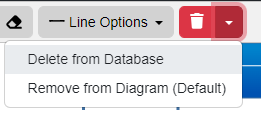
- Click the ‘Remove’ button to remove the entity from the diagram (as the default action).
The ‘Remove’ button also includes a drop-down menu where you can select ‘Delete from Database’ or the default option of ‘Remove from Diagram.’
Tutorial Video
To continue learning about General Diagrams, Click Here.
(Next Article: Timeline Diagram Modifications & Settings)