
| Timescale Modifications | Modifying the Timescale's appearance on the canvas. |
| Timeline Name Modifications | How to change the Timeline Name's appearance. |
| Timeline Indicators Modifications | Changing the coloring of the Timeline indicators. |
| Milestone Modifications | How to edit the Milestone constructs. |
| Lines Modifications | Review of the line modification options. |
| Timeline Diagram Timescale & Settings | An ovrview of the Timeline Diagram Settings options. |
Timescale

When users select the timescale, it can be modified with the options provided on the top of the toolbar frame. These options are explained below:
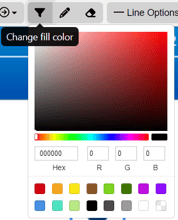
 Users may change the text color using the HTML color menu by using the Hex, R, G, B fields or the color scale or options available on the menu.
 The fill color of the timescale will be available to be changed with this option. The HTML color menu will dropdown for users to select their desired color.
 The Change stroke/line color option may be changed with this option. USers will see the HTML color menu dropdown for users to select their desired color.
 Users can reset the timescale back to the blue and white defaulted colors with this option.
Timeline Name

When users select the name of the Timeline on the right side of the canvas, they have the ability to modify a Timeline's appearance using the options highlighted above. In the following section, we will explain each option in detail.
 Users may bold the name of the Timeline on the canvas.
 Users may italicize the name of the Timeline on the canvas.
 This option will allow users to change the Name of the Timeline's color.
 Users may reset the Timeline construct's name back to the defaulted black.
  Users may also hide/show a Timeline construct's name.
Timeline Indicators

When a Timeline indicator is selected on the canvas, users may modify itthe right triangle's appearance with the options on the top of the toolbar frame, as highlighted above. Below we will cover these options. Please note that the left gray triangle on the timeline diagram cannot be changed or modified.
 With this option, users may change the fill color of the most right triangle by selecting their color on the HTML Color Menu.
 With this option, users may change the line color usrrounding the right triangle with the HTML Color Men that drops down.
 Users can change the right triangle back to the defaulted blue.
⚠️When users select multiple actions by left clicking outside of the timeline constrcuts and dragging the box that appears on the canvas to select multiple timelines, the above options discussed will also be provided to modify the right triangles all at once.
Milestone

When users select a milestone construct on the canvas, its appearance can be modified with the options provided on the top of the toolbar frame as shown above. Below each option will be covered.
 Users may change the fill color of the Milestone with the HTML Color Menu that drops down.
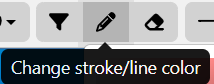 Users can change the line color surrounding the milestone diamond by selecting their desired color from the HTML Color Menu.
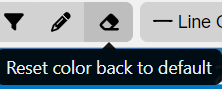 Users may reset their changes back to the defaulted blue colors.
Dependency Lines

Dependency lines between actions may be modified with options highlighted below. We will cover each option in this section.
 This option allows users to change the color of the line selected with the HTML Color Menu that drops down.
 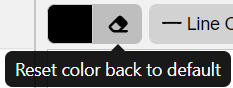 Users may reset their lines back to the defaulted black color.
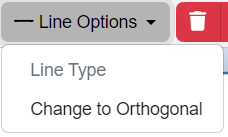 The line options dropdown allows users to change the line from straight to orthogonal, or vice versa.
Timeline Diagram Settings
Customize Timescale
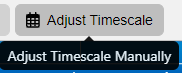
When no construct is selected, the Adjust Timescale button is available on the top of the toolbar frame for users to

1. This will change the timescale of the timeline diagram. Click the ‘Save’ button located on the toolbar to persist your changes to your project’s database.
Timeline Diagram Settings
The wrench icon on the top right of the toolbar frame on the Timeline Diagram is a fixed menu that provides users options to utilize for their diagram.

Number of Levels
To change the number of levels displayed on the canvas, expand the number of levels option and click on the desired level. Note the blue bar next to the wrench icon indicates how many levels are displayed on the diagram canvas.
Add/Remove Lines and Indicators
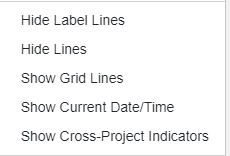
The Settings menu provides users the ability to show or hide lines of relationships among actions, label lines, grid lines, the current date/time indicator and/or cross-project indicators.
Auto Number, Reset & Help
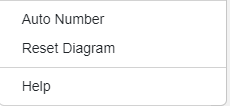
Users may also autonumber their actions on the Timeline Diagram by their displayed order, autonumber the most lowest level and/or add a prefix.

Lastly, users have the option to reset the digram back to the default state and use the Help option to direct them to the Timeline Diagram's Help Center page.
To continue learning about General Diagrams, Click Here.
(Next Article: Tree Diagram)