
Using Risk Diagrams
| Function | Description |
|---|---|
| Creating Risk Diagrams | Using ‘Diagrams View’ in Innoslate, you can create a new ‘Risk Diagram.’ |
| Viewing Risk Diagrams | You can ‘View a Risk Diagram’ of any new or existing entity of the Risk class via the ‘Open’ drop-down menu, where available. |
| Adding an Entity | An entity can be added to a ‘Risk Diagram’ via drag-and-drop. |
| Removing an Entity | An entity can be easily removed from a ‘Risk Diagram.’ |

The ‘Risk Diagram’, also known as a ‘Risk Matrix’, is used to visualize the severity of consequence versus probability. This diagram is capable of displaying up to three levels of decomposition of risks, and conforms to the LML Specification 1.2 definition of a ‘Risk Matrix.’
The ‘Risk Diagram’ is composed of 'Risk' constructs. In addition, Innoslate has the capability to generate a 'Risk Diagram' in real-time using the information stored in your project's database. The ‘Risk Diagram’ is built using entities in the database of the ‘Risk’ class. The entities display as text within each severity-level block containing the number and name of the entity.
Creating Risk Diagrams
Within the ‘Diagrams Dashboard,’ users can create a new diagram by clicking the ‘ Create Diagram’ button in the top right corner of the page.

Clicking the ‘Create Diagram’ button will open the Create Diagram dialog where you will be directed through the process of creating a new diagram.
Create a Risk Diagram
- Choose Which Type of Diagram to Create
In step 1, select ‘Risk Diagram,’ under ‘LML,’ as your diagram type.

Click the ‘Next’ button.

- Specify New Root Risk Information
In step 2, you will be prompted to input a diagram ‘Name,’ ‘Number’ (optional), and ‘Description’ (optional). Then, click the ‘Finish’ button to save and automatically open your new Risk Diagram.

Viewing Risk Diagrams
In Innoslate, you can view a ‘Risk Diagram’ from wherever the ‘Open’ drop-down menu is available on the toolbar (Entity View, Database View, within a Diagram).
View a Risk Diagram

- Locate and click the ‘Open’ drop-down menu in the toolbar. Select ‘Risk Diagram.’
- This will navigate you to view a ‘Risk Diagram,’ where you can begin adding and removing entities. Click the ‘Save’ button located on the toolbar to persist your changes to your project’s database.
Adding an Entity

An entity can be added to a ‘Risk Diagram’ via drag-and-drop.
- Within a ‘Risk Diagram,’ ensure you do not currently have a Risk selected, and click the ‘Risk’ icon in the ‘New’ tab of the left sidebar and continue to hold down the left mouse button.

- Drag the ‘Risk’ identifying text (name and/or number) over to the adjacent diagram canvas.

- Release the left mouse button while over the diagram canvas to the desired severity-level block to drop the new ‘Risk’ and add it to the diagram.
Notice the ‘Risk’ stays selected once it has been dropped. Since it is selected, the toolbar changes to include buttons for functions that can be used on the construct. The sidebar also changes to show the ‘Metadata,’ ‘Attributes’ and ‘Relationships’ tabs.
- Enter a meaningful ‘Name’ for your new ‘Risk’ via the ‘Attributes’ tab of the left sidebar (focused automatically for convenience).

Notice the Consequence and Probability attributes for the Risk correspond to its location on the Matrix. - Click on the canvas outside of the matrix and click the ‘Save’ button located on the top of the toolbar to persist your changes to your project’s database.

Note: The above process describes using the ‘New’ tab of the left sidebar, which automatically generates a new entity to represent each new block. If you would like to reuse existing entities from your database in your diagram, use the ‘Existing’ tab instead.
Removing an Entity
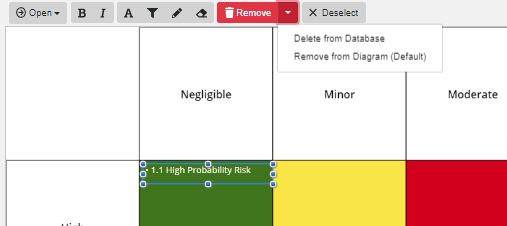
An entity can be easily removed from a ‘Risk Diagram.’
- Within a ‘Risk Diagram,’ select the entity you wish to remove. This will make the toolbar appear with applicable functions which can be used on the selected entity.

- Click the ‘Remove’ button to remove the Risk from the diagram (as the default action) or Delete from Database to apply that option for the selected Risk.
To continue learning about General Diagrams, Click Here.
(Next Article: Risk Diagram Modifications & Settings)