
Using Radar Diagrams
| Function | Description |
|---|---|
| Creating Radar Diagrams | Using ‘Diagrams View’ in Innoslate, you can create a new ‘Radar Diagram’. |
| Radar Diagram Constructs | The ‘Radar Diagram’ supports two unique diagram constructs: ‘Characteristic’ and ‘Measure’. |
| Adding Radar Constructs | A ‘Characteristic’ or ‘Measure’ construct can be added to a ‘Radar Diagram’ via drag-and-drop. |
| Removing a Construct | A construct can be easily removed from a ‘Radar Diagram.’ |
| Radar Customization | Many of the ‘Radar Diagram‘ features can be customized including the colors, background shape, grid lines, and the positioning of the Characteristics around the radar. |
The ‘Radar Diagram’ is used to visualize multiple Characteristics and Measures applied to an Asset.

The ‘Radar Diagram’ is not composed of special diagram constructs. A ‘Radar Diagram’ can be generated by Innoslate on the fly based on the Characteristics and Measures of the root Asset entity’s specified by relationship. The ‘Radar Diagram’ is built using ‘Asset,’ ‘Characteristic’ and 'Measures' entities. The entities are displayed as radar vector shapes and the shape and colors between them can be customized by the user.
Creating Radar Diagrams
Within the ‘Diagrams Dashboard,’ users can create a new diagram by clicking the ‘ Create Diagram’ button in the top right corner of the page.
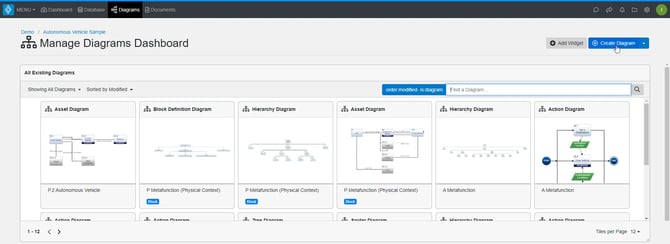
Clicking the ‘Create Diagram’ button will open the Create Diagram dialog where you will be directed through the process of creating a new diagram.
Create a Radar Diagram
- Choose Which Type of Diagram to Create
In step 1, select ‘Radar Diagram,’ under ‘LML,’ as your diagram type.

Click the ‘Next’ button.

- Specify New Root Action Information
In step 2, you will be prompted to input a diagram ‘Name,’ ‘Number’ (optional), and ‘Description’ (optional). Then, click the ‘Finish’ button to save and automatically open your new Radar Diagram.
Radar Diagram Constructs
The ‘Radar Diagram’ supports two unique diagram constructs: a ‘Characteristic’ and a ‘Measure.’ Each diagram construct is described in more detail below:
-
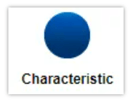
Characteristic
In the diagram, this construct is represented as a solid blue circle for the thumbnail, though in the diagram itself only the entity name and number is displayed.
-
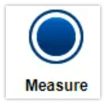
Measure
In the diagram, this construct is represented as a solid blue circle with a ring around it for the thumbnail, though in the diagram itself only the entity name and number are displayed.
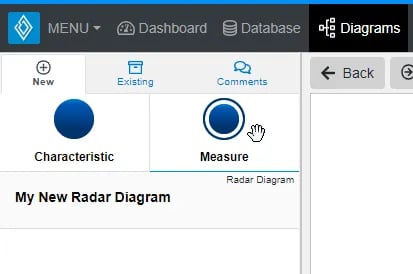
Adding Radar Constructs
A ‘Characteristic’ or ‘Measure’ construct can be added to a ‘Radar Diagram‘ via drag-and-drop.
- Within a ‘Radar Diagram,’ click either the ‘Characteristic’ or ‘Measure’ icon in the ‘New’ tab of the left sidebar and continue to hold down the left mouse button.
- Drag the icon over to the adjacent diagram canvas.

- Release the left mouse button anywhere over the diagram canvas to drop the new ‘Characteristic’ or ‘Measure’ and add it to the diagram. The diagram will automatically ‘snap’ the shape around the edge of the radar.

Notice the text stays selected once it has been dropped. Since it is selected, the toolbar changes to include buttons for functions that can be used on the construct. The sidebar also changes to include additional ‘Metadata,’ ‘Attributes,’ and ‘Relationships’ tabs.
- Once added to the diagram, enter a meaningful ‘Name’ for your new construct via the ‘Attributes’ tab of the left sidebar (focused automatically for convenience).

- Click the ‘Save’ button located on the toolbar to persist your changes to your project’s database.

* Note: The above process describes using the ‘New’ tab of the left sidebar, which automatically generates a new entity to represent each new diagram construct. If you would like to reuse existing entities from your database to represent a new construct, use the ‘Existing’ tab instead.
Removing a Radar Construct
A construct can be easily removed from a ‘Radar Diagram.’
- Within a ‘Radar Diagram,’ select the 'Characteristic' or 'Measure' you wish to remove. This will make the toolbar appear with applicable functions which can be used on the selected construct.

- Click the ‘Remove’ button to remove the construct from the diagram (as the default action).

Note: The ‘Remove’ button also includes a drop-down menu where you can select ‘Delete from Database’ or the default option of ‘Remove from Diagram.’
To continue learning about General Diagrams, Click Here.
(Next Article: Radar Diagram Modifications & Settings)