
| Name Editing | Review of the editing options for names on the Radar Diagram. |
| Radar Diagram Customization | Overview on customizing the Radar Diagram. |
| Radar Diagram Settings | Overview of the Radar Diagram Settings menu. |
Name Editing

When selecting the name of a Characteristic or Measure, the top toolbar will change and provide the following options for editing.
Bold
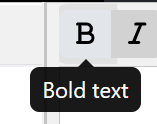
This option will Bold the name selected on the canvas.
Italicize
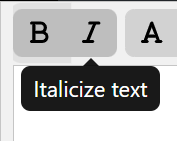
This option will Italicize the name selected on the canvas.
Change Text Fill Color

Using the HTML Color Picker that drops down from the Text Fill Color Option, users can change the text color of the name selected on the canvas by selecting the color associated close to the desired color and/or inputting in the Hex, R, G, B fields the proper codes and numbers.
Reset Color back to default
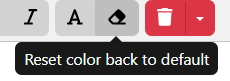
The Reset color back to default option will change the name selected on the canvas back to the default black color.
Radar Customization
Many of the ‘Radar Diagram‘ features can be customized including the colors, background shape, grid lines, and the positioning of the Characteristics around the radar.
Radar Preferences
To edit the ‘Radar Preferences’, click the ‘ Edit Radar Preferences‘ button in the diagram toolbar.

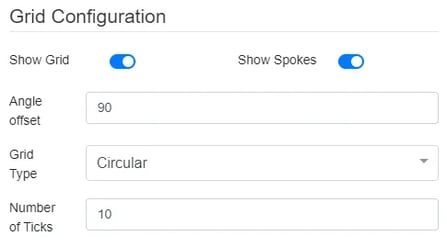
From the ‘Radar Preferences’ modal that pops up, users may change the radar display settings including the ‘Show Grid’ (turning this off removes the circular background lines), ‘Show Spokes’ (turning this off removes just the lines that go to each Characteristic around the radar), ‘Angle Offset’ (sets how many degrees to rotate the radar – default is 90), ‘Grid Type’ (either ‘Circular’ as shown or ‘Polygonal’), and the ‘Number of Ticks’ (alters the axis step count and interval).
Users can also customize which colors to use for each of the ‘Radar Diagram’ attributes by clicking on the colorful ‘ Pencil’ button to open the color picker.

Once the settings changes are ready, click ‘Apply‘ to update the ‘Radar Diagram’ with the new preferences.

With the preference changes just made above, the ‘Radar Diagram’ now looks like this:

Radar Diagram Settings
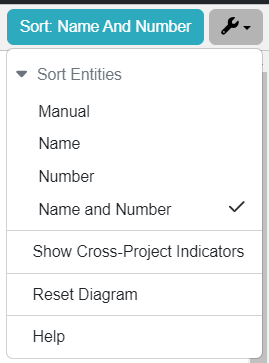
The Settings dropdown is the Wrench icon on the top right of the toolbar frame. The above options are shown for this dropdown for the Radar Diagram. Below, we will cover each of these options on the menu.
Sorting Radar Vertices
By default, ‘Radar Diagram’ vertices are sorted by the entity ‘Number and Name’; however, this can easily be changed by clicking the wrench in the top right corner of the diagram. Expand the ‘Sort Entities’ dropdown header and then click the sort option you wish to apply.
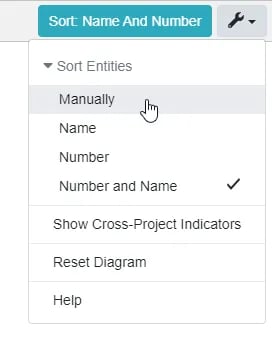
The ‘Name’, ‘Number’, and ‘Number and Name’ options all update the radar vertices automatically when one of its construct's names or numbers have changed. However, the sort ‘Manually’ option allows users to place each vertex in a specific order, regardless of any of the entity attributes.
After clicking the ‘Manually’ option, select one of the vertices. Notice that the toolbar now has both ‘Move CCW’ (counter-clockwise) and ‘Move CW’ (clockwise) buttons.

Click either of these buttons to move the currently selected entity around to the desired position on the ‘Radar Diagram’, as demonstrated below:

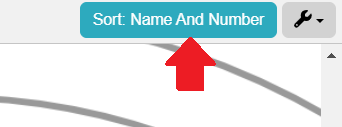
Note, the Blue indicator next to the wrench dropdown indicates how the constructs are sorted in the diagram:
Show/Hide Cross-Project Indicators
This selection allows users to hide or show the indicators on the constructs being brought in from other projects.
Reset Diagram & Help
Users may reset the diagram after changes have been made.
The very last option, 'Help,' will send users directly to the Help Center page for the Radar Diagram for their convenience.
To continue learning about General Diagrams, Click Here.
(Next Article: Risk Diagram)