
The Spider Diagram is a radial hierarchical diagram in Innoslate used to visualize traceability across entities. It displays up to 10 levels of decomposition in concentric circles radiating from a central root entity, providing enhanced traceability beyond standard hierarchy diagrams. This aligns with the Lifecycle Modeling Language (LML) specification for traceability visualization.
| Function | Description |
|---|---|
| Creating Spider Diagrams | Using ‘Diagrams View’ in Innoslate, you can create a new ‘Spider Diagram.’ |
| Viewing Spider Diagrams | You can ‘View a Spider Diagram’ of any new or existing entity of any class via the ‘Open’ drop-down menu, where available. |
| Adding an Entity | An entity can be added to a ‘Spider Diagram’ via drag-and-drop. |
| Impact Analysis | Select an entity to enable the Impact Analysis tool. |
| Removing an Entity | An entity can be easily removed from a ‘Spider Diagram’. |
| Modifying Relationship Lines | The Relationships attributes can easily be modified in the ‘Spider Diagram’. |
| Spider Diagram Settings | Overview of the Spider Diagram Search & Settings Menu |
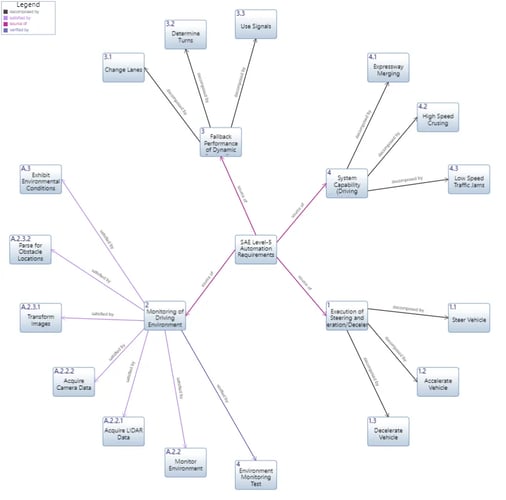
Figure 1: Spider Diagram
Spider Diagrams are dynamically generated from your project's database. They use existing entities of any class and their relationships—no special constructs are required. Entities appear as rounded blocks showing the entity number and name, while relationships are represented as labeled arrows.
Creating Spider Diagrams
Figure 2: Creating a Spider Diagram Video
From the Diagrams Dashboard:- Click the 'New Diagram' button in the top-right corner.
- In the New Diagram dialog:
- Select 'Spider Diagram' under the LML category.
- Choose the entity class for the root entity.
- Click Next.
- Enter the diagram Name, optional Number, and optional Description.
- Click Finish to create and open the new Spider Diagram.
Note: You can start with any entity class as the root.
Viewing Spider Diagrams
Open a Spider Diagram for any entity from locations where the Open drop-down menu is available (e.g., Entity View, Database View, Documents, Diagrams, Test Suites. etc.):
Viewing a Spider Diagram
Open a Spider Diagram for any entity from locations where the Open drop-down menu is available (e.g., Entity View, Database View, Documents, Diagrams, Test Suites, etc.):
- Locate and click the ‘Open’ drop-down menu in the toolbar.
- Select ‘Spider Diagram.’
This opens the diagram centered on the selected entity. Add or remove entities as needed, then click Save on the toolbar to persist changes.
Left Sidebar of Spider Diagram

The left sidebar in Spider Diagram view provides tools for adding entities and managing relationships.
- Entity Class Dropdown (New tab): Select the class of entities to add via drag-and-drop. It lists all available classes in your project.
- Relationship Presets Dropdown: Select from built-in presets (such as Traceability Relationships or All Relationships) or any custom presets you have created.
- Traceability Relationships: Default preset showing primary LML traceability relationships.
- All Relationships: Displays all relationships connected to the root entity (useful for existing entities).
- Custom user-created presets.
- Relationship Selection Dropdown: Choose specific relationship types to include.
- Save Preset: This option appears after creating a custom grouping of relationships in the Relationshp Selection field . It allows users to save the selection as a new preset. A pop-up will prompt for a preset name, making it available for future recall in the Presets Dropdown.
- Generate button: Applies selected relationships to the canvas.
- Remove Preset: Delete user-created presets.
Adding an Entity
An entity can be added to a ‘Spider Diagram’ via drag-and-drop.
-
Ensure no entity is selected on the canvas.
-
In the New tab of the sidebar, select the desired class in the class entity dropdown.
-
Drag it to the canvas and release.
-
The new entity remains selected, updating the toolbar and sidebar to show Metadata, Attributes, and Relationships tabs.
-
-
Enter a Name in the Attributes tab.
- To create a relationship:
- Click and hold one of the green connection points on the entity.
- Drag to another entity on the canvas (it will highlight green when the connection is made).
- Release the mouse button to open the Create New Relationship dialog.
- Select or type the desired relationship name.
- Click Create.
- Click on white space in Canvas to change focus outside of new entity.
- Click 'Save' to persist changes.
Note: Relationships in Innoslate are bi-directional by default. As shown in the tutorial video, connecting from the source entity to the new target entity created the same relationship as shown already in the diagram.
Note: The New tab creates new entities. Use the Existing tab to add preexisting entities from the database.
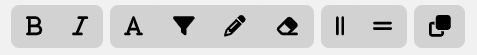
Modifying Entities (Single Selection)

When an entity is selected, there are options available on the top toolbar frame to modify the entity, as shown below.

- Bold/Italic: Apply to the entity name text.
- Change Text Fill Color: Select text color via HTML picker.
- Change Fill Color: Change the entity's background color.
- Change Stroke/Line Color: Change the border color.
- Reset Colors: Restore default colors.
Impact Analysis Tool
When an entity is selected on the Spider Diagram canvas, Innoslate provides an Impact Analysis tool to assess upstream and downstream traceability impacts.
This tool appears in the toolbar (often as an icon or option when an entity is selected) and allows you to:
- Visualize potential changes' effects on related entities.
- Identify upstream (incoming) and downstream (outgoing) relationships.
- Evaluate traceability chains for risk, requirements flow, or verification impacts.
Use this for change management: Simulate the impact of modifying or deleting the selected entity before committing changes.
For more on the Impact Analysis see: Impact Analysis Tool
Removing an Entity
An entity can be easily removed from a ‘Spider Diagram.’
- Within a ‘Spider Diagram,’ select the entity you wish to remove. This will make the toolbar appear with applicable functions which can be used on the selected entity.
- Click the ‘Remove’ button to remove the entity from the diagram, as the default action.
- The ‘Remove’ button also includes a drop-down menu where you can select ‘Delete from Database’ or the default option of ‘Remove from Diagram.’
Line Construct Labels
Note that users also may drag the label of the line construct on the canvas, by selecting the name and dragging it. Upon doing so, a line will appear to indicate the Line construct label's name, as indicated in the red circle below.

Modifying Relationships (Line Selection)

Select a relationship arrow (it will highlight in blue):

- Bold/Italic: Apply to the relationship label text.
- Change Text Fill Color: Change the color of the label text using the HTML color picker.
- Change Stroke/Line Color: Change the color of the arrow line using the HTML color picker.
- Reset Colors: Restore the line and label text to default black.
- Additional options: Switch line type (straight or orthogonal), show/hide the relationship label, or reset styling.
To change the color of individual lines, please use this method.
If you'd like to change the colors of the lines by relationship, please use the Settings Menu> Edit Colors.
Modifying Relationship Attributes
The Relationships attributes can easily be modified in the ‘Spider Diagram’.
- Click a relationship arrow.

- Click the 'Attributes' button on the toolbar.

- Edit the desired attributes in the modal dialog.
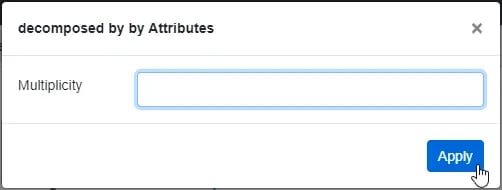
- Click Done to save changes, or X to cancel.
Multiple Entity Selection

Drag a selection box around multiple entities for the following options to appear in the toolbar:
- Bulk apply Bold, Italic, text/fill/stroke colors, or reset colors.
- Align Vertically/Horizontally (anchored spot on the highlighted entity).
- Clone Shape: Uniform size based on the highlighted entity
Spider Diagram Indicator, Search & Settings

Spider Diagram - Indicators, Search & Settings Menu
Indicators
Number of Levels– Indicates the levels shown on the canvas (up to 10 levels). The current level is indicated in blue next to the Search field.
Search
The Search field allows users to search the Name, Number and Description fields of the entities displayed on the diagram canvas.
Settings
Click the wrench icon in the top-right corner of the toolbar to open the diagram settings menu. These settings are always available, regardless of selection.
- Levels: Set displayed traceability levels (1–10).
- Edit Colors: Customize relationship colors (pencil for picker, eraser for default). Reset all via button.
- Show/Hide: Cross-project indicators, legend, colors (hiding colors turns lines/labels black).
- Reassign Colors: Restore default schema colors for modified lines.
- Edit Spacing: Allows you to determine length of relationship lines to bring diagram closer together.
- Disable External Auto Layout: Prevents automatic layout changes triggered by external entity updates, preserving your manual layout.
- Auto Number: Number entities by order, with optional prefix or single-level enumeration.
- Reset Diagram: Clear customizations.
- Layout Diagram: Auto-arrange entities.
- Help Center Link: Direct to this article.