

Creating a Risk Burn-Down Chart
Step 1: Navigate to ‘Charts Dashboard’, then click on ‘New Chart’
.png?width=160&name=xy_0%20(1).png)
Step 2: Choose ‘Risk Burn-Down’, give the root Risk a name or number, then click ‘Next’, then click ‘Finish’.

.png?width=377&height=326&name=chrome_5engXiOSw3%20(1).png)

Utilizing Existing Datasets
Step 1: Browse the parent’s Risk Diagram.


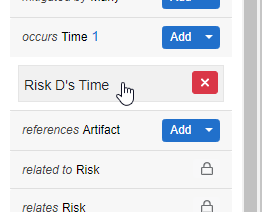
Step 2: Select each Risk and give it an “Occurs” relationship with a new Time entity, and give each new Time entity a date and time of occurrence, and a Duration.

Step 3: Once all the Risk Entities have Time entities related to them, navigate back to the Risk Burn-down chart.
Adding New Datasets
Step 1: Within the Risk Burn-down chart, select the ‘View Datasets’ on the toolbar.

Step 2: Click ‘Add New Risk’ and choose to either create a new Risk or use an existing one.
Note: The line colors, point styles, and other formatting specifications can also be changed from this menu.

Step 3: Add the necessary Risk information, and click the green check button (near the top below the line options section) to add the new Risk to the dataset. You'll know it's been added once it is added on the Time/Probability Table on the bottom of the View Datasets Dialog.
Step 4: Edit the time of occurrence (automatically set to the current time) by selecting the date and time as necessary. Then click ‘Apply’.

Step 5: View your new data and verify for accuracy by selecting the Risk entity to open it's information on the left sidebar.

Risk Burn-Down Settings

Under the Settings Menu click on the wrench button at the top right, where you can indicate if a Risk entity is a Cross-Project entity with the 'Show/Hide Cross-Project Indicators' or be directed to this page with 'Help'.
To edit and configure your Risk Burn-Down Chart, select ‘Edit Settings.'
With the Risk Burndown Settings Dialog you can edit the overall look of your Risk Burn-Down Chart, such as the Grid's settings, colors, axis settings and selected point settings. After the changes have been made, scroll down to the bottom and click on ‘Apply’.

Tutorial Video
To continue learning about Charts, Click Here.
(Next Article: Gantt Chart)