
Creating a Gantt Chart
Step 1: Navigate to ‘Charts View,’ then click on ‘New Chart’.
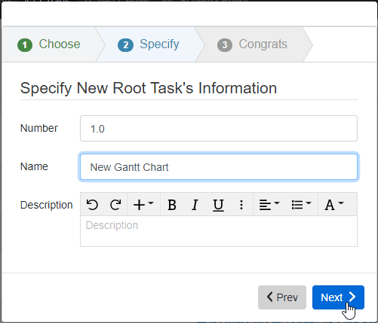
Step 2: Choose ‘Gantt Chart’ and Select ‘Next’.

Step 3: Give the root Task a name or number, then click ‘Next’ and ‘Finish’.
Adding New Tasks
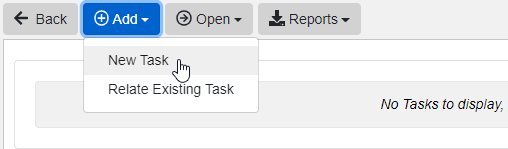
To add a Task entity to the Gantt Chart, click the ‘Add’ button dropdown in the toolbar and then either ‘New Task’ or ‘Relate Existing Task’.
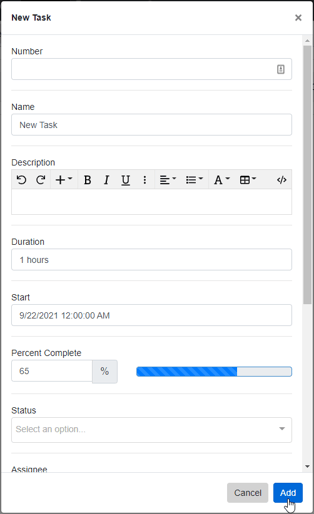
If creating a new Task, specify a name or number, the Start Date, and the Duration for the Task, and then click ‘Add.’ Make sure that the Selected Task has both a Duration and Start Date or else the Task will not be able to be added to the chart.
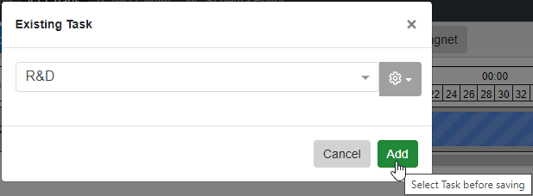
If adding an existing Task, use the entity multi-selector in the dialog to choose a Task and then click ‘Add’. Make sure that the Selected Task has both a Duration and Start Date or else a warning will be displayed.
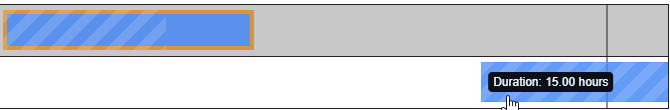
Note: A task's Percentage will be shown on the task with a stripped progress bar put over the task.
Scale
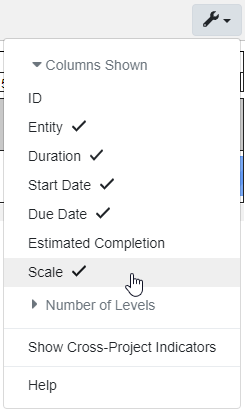
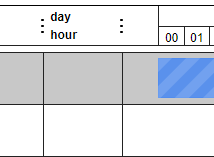
The Scale is found directly above the Gantt Tasks, to the right of the attribute columns. The Scale has two components, the Primary/Larger Scale and the Secondary/Smaller Scale. The unit of the primary and secondary scales can be found by either hovering over the scales or adding the scale to the attribute columns.
Zoom
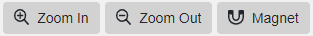
To Zoom In/Out with the Gantt Chart, click the ‘Zoom In’, ‘Zoom Out’, or ‘Magnet’ buttons in the toolbar.
If the ‘Zoom In’ button is clicked, the time scale will Zoom in as well as increase the size of each task.
If the ‘Zoom Out’ button is clicked, the time scale will Zoom out as well as decrease the size of each task.
If the ‘Magnet’ button is clicked, the time scale and task size will be reset to the Gantt Chart’s initial size.
Select Task/Dependency
Click on a Task’s bar/Tasks Attribute columns or the Dependency’s arrow to select it, which will highlight the Task’s bar/ Dependency’s arrow purple and show the ‘Metadata’, ‘Attributes’, and ‘Relationships’ tabs on the left sidebar.
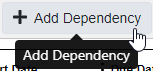
If Task is selected, the ‘Remove’, ‘Add Dependency’, ‘Move to Entity’ and the ‘Open’ buttons will display in the toolbar.

If Dependency is selected, the ‘Remove’, ‘Edit Dependency,’ and ‘Open’ buttons will display in the toolbar.

Note: The ‘Remove’ button also includes a drop-down menu where you can select ‘Delete from Database’ or the default option of ‘Remove from Chart’.
Changing the Name, Number, Due Date, Start Date, Percent Complete, Scale, or Estimated Completion on the Task entity will be reflected immediately on the Gantt chart provided the Column for that given Attribute is shown.
Adding New Dependencies
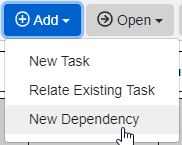
To add new Dependencies to the Gantt Chart, either click the ‘Add’ button dropdown in the toolbar and then click ‘New Dependency,’ or select a Task and then click the ‘Add Dependency’ Button.
If a Task wasn’t previously selected as the source, select a Task to be the source (highlighted in orange). Next Select the target Task.
Once the ‘Create Dependency’ Modal appears, choose whether the arrow will go on the start or end of the task. Then click the ‘Add’ button.

Note: The ‘Edit Dependency’ works similarly to the ‘Create Dependency’ button except the selected Dependency will be altered instead of a new Dependency being made.
Reports
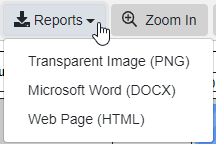
To create Reports click the ‘Report’ button dropdown in the toolbar.
If the ‘Transparent Image’ option is selected, A Transparent PNG image of the Gantt chart will be created.
If the ‘Microsoft Word’ option is selected, A Word Docx containing an image of the Gantt Chart will be created.
If the ‘Web Page’ option is selected, A Web Page/HTML page containing a Gantt Chart will be created.
Tutorial Video
To continue learning about Charts Dashboard, Click Here.
(Next Article: Kanban Board)