
Sections Available in Monte Carlo Simulator
| Function | Description |
|---|---|
| Overview | Gain an understanding of the simulator, its capabilities, and how it can be utilized to model and simulate systems in Innoslate. |
| Classic Mode | The Classic Mode offers a traditional approach with event-based modeling and simulation execution on Innoslate (deprecated in v4.12.3). |
| Feature Panels | Discover the variety of featured panels in the simulator, providing interfaces for configuring simulation settings on Innoslate. |
| Simulator Reports | Learn how to generate detailed reports and analyze simulation results in the Discrete Events Simulator. |
Overview
Innoslate’s ‘Monte Carlo Simulator’ allows for a realistic analysis of a system or project’s cost, schedule, and performance. This simulator utilizes the same modeling techniques and technologies as the ‘Discrete Event Simulator,’ but removes inherent uncertainty. This is accomplished by running the simulation repeatedly with different, random seeds to achieve a more comprehensive view of the model. An example of the results generated by running the ‘Monte Carlo Simulator’ is shown below:

The simulator consists of a sidebar to the left and a set of panels to the right which can be shown, hidden, re-sized, and sorted in any order to best meet your needs. By default, the simulator displays the following panels: Status, Time Tree Map, Time Bar Chart, Asset Utilization (Radar), Cost Tree Map, Cost Bar Chart, and Resources (Radar).
Features
- Moving: Panels can be moved by clicking on the panel and dragging, allowing the panels to be ordered as needed.
- Remove: Panels can be removed by clicking the X on the right side of the panel.
- Locking: Panels can be locked into place by pressing the lock on the right side of the panel, Stopping the panel from being moved. Panels can be unlocked by re-clicking the lock. A locked panel will have a discolored header to signify that the panel is locked.
- Resizing: Panels can be resized by clicking and dragging the small arrow to the bottom right of the panel.
- Editing: Some panels have the ability to edit the information collected during the simulation. These panels usually have a model that will pop up when the panel is placed. To edit these panels, click the gear on the top right corner of the panel.
- Reports: Some panels have reports that can be downloaded once the simulation has been run. These reports can be found by clicking the report dropdown button on the top right of the panel after the simulation is complete.
Available Settings in Monte Carlo
- Display Mode: Enables switching between a dark theme and a light theme view of the simulator.
- Calendar Mode: Enables calendar-driven simulations based on the entity ‘Start’ attribute. By default, if Calendar Mode is enabled and the root entity doesn’t have a ‘Start’ attribute set, the current time is used as the sim start time. Note that to use Calendar Mode, all actions in the sim must either not have a ‘Start’ attribute or one that occurs after the root entity ‘Start’ time.
- Iterations: The number of simulator iterations to run. By default, this is set to 100.
- Hours per year: Enables simulating an average working calendar year, e.g,. 1860 working hours per year.
- Max Cores: The maximum number of cores the simulator will use. By default, this will use the browser-determined number of cores for your computer. Note that for Safari users only, this value must be explicitly set or the simulation will not run!
- Matlab Integration URL: This allows the simulator scripts to connect to Matlab through a server URL.
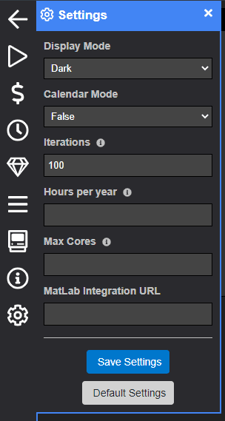
Note: Once the simulation has started running, only the Display Mode option can be changed.
Classic Mode
The Classic Simulator is the older version of the simulator. This Simulator has its own settings and layout and has all the functionality of the Classic Simulator.
Classic Mode has been deprecated as of v4.12.3.
All of the panels available on the modern mode of Innoslate's simulator, are also available in Classic Mode.

With its intuitive interface, Classic Mode simplifies the process of setting up simulation parameters, defining event sequences, and monitoring simulation progress. You have full control over the simulation timeline and can observe the impact of different events and resource allocations on the system's overall performance.
Featured Panels
Within the ‘Monte Carlo Simulator,’ there are four (4) categories of panels, listed below, which are available to be displayed:
- Cost Panels
- Time Panels
- Resource Panels
- Other Panels
Cost Panels
Cost Tree Map
Displays a tree map of the combined total incurred costs of the simulations of the Monte Carlo run.

Reports that can be created from this panel are:
- Action Cost Report:
- Generates a CSV report of the cost of each Action entity per simulation of the Monte Carlo run.
- For this report, you can select the columns, the sort of columns, and the file name.
- Opaque Image Report
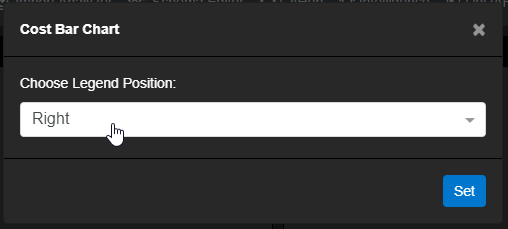
Cost Bar Chart
Displays a bar chart of the total incurred cost of each simulation in the Monte Carlo run.

On startup, a model will pop up to select the panel’s specific options. This panel has an option to select the position of the legend. By default, the chart’s legend will be on the right-hand side of the panel.
Reports that can be created from this panel are:
- Monte Carlo Cost Report:
- Generates a .CSV report of the total cost of each simulation of the Monte Carlo run.
- For this report, you can select the columns, the sort of columns, and the file name.
- Transparent Image Report
- Opaque Image Report
Time Panels
Time Tree Map
Displays a tree map of the combined total durations of actions in the simulations of the Monte Carlo run.

Reports that can be created from this panel are:
- Action Duration Report:
- Generates a CSV report of the cost of each Action entity per simulation of the Monte Carlo run.
- For this report, you can select the columns, the sort of columns, and the file name.
- The report gives the option of raw duration (in milliseconds), formatted duration, or both.
- Opaque Image Report
Time Bar Chart
Displays a bar chart of the total duration of each simulation in the Monte Carlo run.

On startup, a model will pop up to select the panel’s specific options. This panel has an option to select the position of the legend. By default, the chart’s legend will be on the right-hand side of the panel.

Reports that can be created from this panel are:
- Monte Carlo Cost Report:
- Generates a CSV report of the average duration of each Action across all simulations of the Monte Carlo run.
- For this report, you can select the columns, the sort of columns, and the file name.
- The report gives the option of raw duration (in milliseconds), formatted duration, or both.
- Transparent Image Report
- Opaque Image Report
Resource Panels
Resources (Radar)
Displays a radar chart of an individual resource’s minimum, maximum, and final amounts.
.png?width=310&name=MonteCarlo_ResourceRadar%20(1).png)
Reports that can be created from this panel are:
- Monte Carlo Resource Report:
- Generates a CSV report of the minimum, maximum, final, and total amounts of each Resource entity per simulation of the Monte Carlo run.
- For this report, you can select the columns, the sort of columns, and the file name.
- Transparent Image Report
- Opaque Image Report
Asset Utilization (Radar)
Displays a radar chart of an individual asset’s amount utilized.
.png?width=326&name=MonteCarlo_AssetUtil%20(1).png)
Reports that can be created from this panel are:
- Monte Carlo Asset Utilization Report:
- Generates a CSV report of the maximum and number of times utilized of each Asset entity per simulation of the Monte Carlo run.
- For this report, you can select the columns, the sort of columns, and the file name.
- The report gives the option of raw total time (in milliseconds), formatted total time, or both.
- Transparent Image Report
- Opaque Image Report
Other Panels
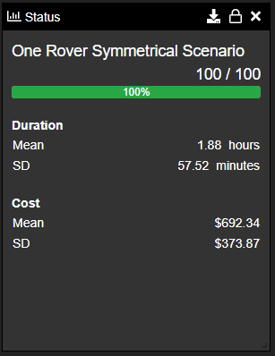
Status
Displays the current number of completed simulations, average duration, and average cost.
Reports that can be created from this panel are:
- Monte Carlo Report
- Generates a CSV report of the overall details of the Monte Carlo run, including mean and standard deviation of Duration and Cost.
- For this report, you can select the columns, the sort of columns, and the file name.
- The report gives the option of raw duration (in milliseconds), formatted duration, or both of both mean and standard deviation Duration. Mean and standard deviation of Cost are also report options.
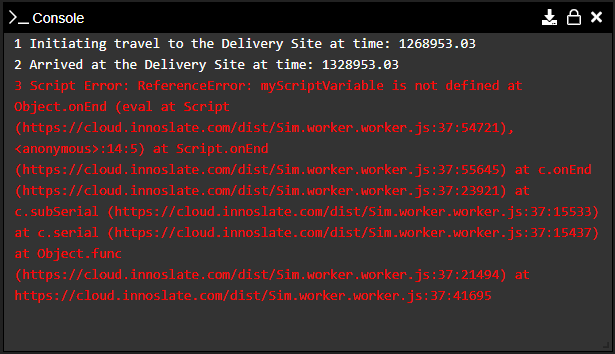
Console
Displays a console showing all scripted print lines and detailed error information.
Reports that can be created from this panel are:
- Console Report
- Generates a .CSV report of all the lines logged from the console.
Simulator Export Reports
- In the ‘Monte Carlo Simulator’ after you run the simulation, select ‘Project Exports’ for XML-based reports in the side menu.
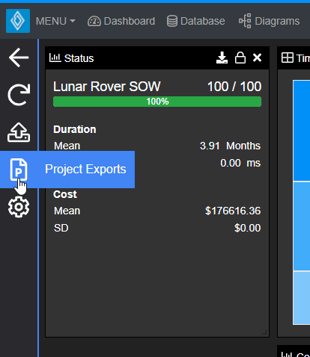
- From ‘Project Exports’ you can select to download a ‘Longest Duration Export,’ a ‘Shortest Duration Export,’ a ‘Highest Cost Export,’ or a ‘Lowest Cost Export.’

Longest Duration Export
Generates an MS Project file as .xml showing the simulation with the longest duration throughout the Monte Carlo simulation.
Shortest Duration Export
Generates an MS Project file as .xml showing the simulation with the shortest duration throughout the Monte Carlo simulation.
Highest Cost Export
Generates an MS Project file as .xml showing the simulation with the highest cost throughout the Monte Carlo simulation.
Lowest Cost Export
Generates an MS Project file as .xml showing the simulation with the lowest cost throughout the Monte Carlo simulation.
Tutorial Video
To continue learning about Simulators, Click Here.
(Next Article: Asset Utilization Over Time)