
Innoslate's latest update brings a valuable Impact Analysis Tool to Spider Diagrams. This tool enables you to instantly visualize the downstream and upstream effects of a selected entity, helping you assess traceability, dependencies, and potential change impacts across your system model. It's ideal for change management, requirements validation, risk assessment, and informed decision-making in systems engineering.
What Is the Impact Analysis Tool?
The Impact Analysis Tool is an interactive mode within Spider Diagrams that:
- Highlights entities directly connected to a selected "source" entity.
- Freezes the diagram temporarily to prioritize analysis and prevent unintended changes to other entities.
- Allows seamless switching between source entities for quick comparisons.
Leveraging the Spider Diagram's radial, concentric layout, this tool provides a clear, intuitive view of complex relationship networks and traceability paths.
Prerequisites
- Available exclusively in Spider Diagrams in Innoslate.
- Requires entities with defined relationships (e.g., decomposed by, derived from, verified by) to display meaningful impacts.
- Open a populated Spider Diagram for best results.
Step-by-Step Guide to Using the Impact Analysis Tool
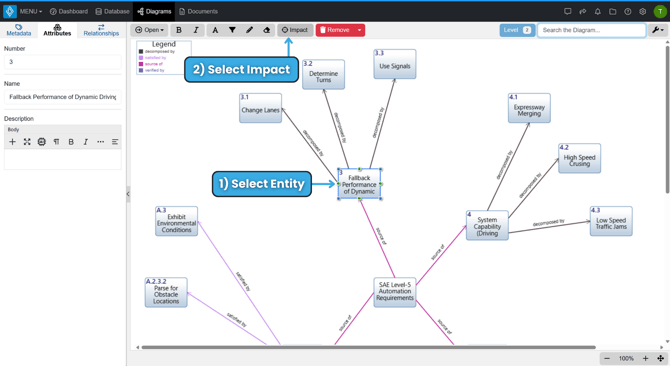
1. Open a Spider Diagram
From the Diagrams Dashboard, open or create a Spider Diagram and add entities as needed.
2. Select the Source Entity
Click the entity you wish to analyze—it becomes the source for impact evaluation.
3. Activate the Impact Analysis Tool
- Click the Impact button on the diagram toolbar.
- The diagram enters Impact Analysis Mode (I.e., "Impact Mode") and freezes (editing and layout changes disabled for all entities except the selected entity).
- Connected entities highlight automatically.
- The Impact button shows a blue shade with a number indicating impact level.
4. Review Impacts
- Examine highlighted entities and connections to understand propagation effects.
- Navigate canvas for relationship types and entity info.
5. Switch Source Entities
In "Impact Mode", click any other entity—the highlights update immediately to show impacts from the new source, enabling fast comparisons.
6. Deactivate the Impact Analysis Tool
- Click the Impact button again.
- The diagram unfreezes for full editing.
- Highlights clear.
The Settings Menu is available for use when "Impact Mode" is activated.
Key Benefits
- Rapid Change Assessment: Instantly visualize the effects of altering any entity in your model, including standard classes like requirements, actions (functions), assets, risks, tests, or custom classes—leveraging the full flexibility of Spider Diagrams which support any entity class or custom schema extensions.
- Risk Reduction: Spot high-impact entities early for focused reviews.
- Enhanced Team Reviews: Demonstrate traceability clearly in shared diagrams.
- Synergy with Innoslate Features: Pairs well with Monte Carlo simulations, traceability matrices, and AI quality checks.
Tips and Best Practices
- Maximize value in models with rich connections—limited relationships yield fewer highlights.
- Apply relationships filters to target specific relationships.
- Begin analysis with central or high-level entities for system-wide views.
- For easier navigation in large diagrams, select 'Edit Spacing' in the Settings Menu to bring the relationships closer together.
The Impact Analysis Tool elevates Spider Diagrams into a dynamic analysis powerhouse, streamlining model-based systems engineering efforts in Innoslate.
To continue learning about tools, Click Here.
(Next Article: Traceability Matrix)