
The Charts Dashboard functions as the central hub for all the charts in an Innoslate project. This dashboard provides users with abilities to create, modify, organize, search, and filter charts according to their preferences. Additionally, users have the option to customize this dashboard and save the layout for their team to access.

- Calendar
- Kanban Board
- Gantt Chart
- Risk Burn-Down
- XY Plot
Navigating to Charts Dashboard
From the 'MENU' dropdown on the top left of the navigation bar, under the 'General' heading. Users have the option to 'Pin' the link to the Navigation Ribbon for convenient access. This is done by hovering your mouse on the right and selecting + 'Pin'.

Adding Widgets to the Charts Dashboard
Users can modify their Dashboard and organize it by the ‘Add Widget’ button on the Charts Dashboard.

A pop up appears allowing users to select from two options:

- The 'All Existing Charts' widget contains all existing saved charts in an Innoslate project. This widget is defaulted to appear on the dashboard, even before any actual charts may already exist.
- The 'Chart Card' widget allows users to easily access an individual chart outside of the 'All Existing' widget. When 'Chart Card 'is selected, users will need to select their desired Chart Type: Calendar, Gantt Chart, Kanban Board, Matrix (Traceability) , Risk Burn-Down and XY Plot. Select the 'Target Entity' (Root Entity of the Chart) and select 'Add'.

After selecting a widget, take note of the 'Save to project' toggle. When enabled, all users who have access to the project will be able to view the widget on their Charts Dashboard.

All Existing Charts Widget

The 'All Existing Charts' widget is where users can conveniently access all of the charts in their Innoslate project. Innoslate users have a variety of options available to them for filtering, sorting, searching, and interacting with charts within this widget.

When users hover their mouse over the top right of the heading bar a 'Lock' appears so that this widget remains in place on their Charts Dashboard.
Users can also remove this widget from their Dashboard by clicking the 'Close (X)'button.
Also, there is a 'Reports' button for users to export their charts as a DOCX or PPTX.

When this 'Reports' button is selected, a pop up appears with a dropdown to allow users to include the image, name, number, description, created by, created on and modified on data to their report. Then users can select DOCX or PPTX for download. Include a name and select the 'Download' button to create the report.

Note, if you've searched or filtered the 'All Existing' widget for certain chart types, only those chart types will be selected for the report.
In the 'All Existing Charts' widget users can filter the charts by chart type:

Sort the charts by most recently created date, most recently modified date, name or number:
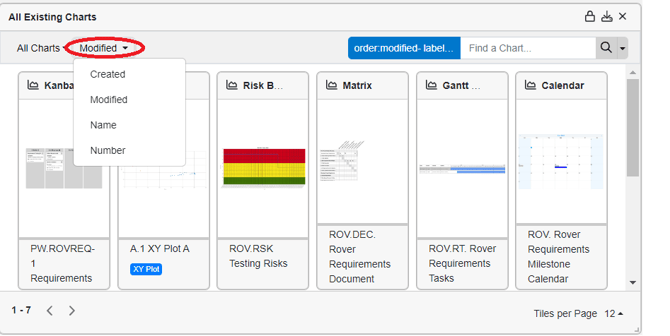
Users may also use the 'Advanced Search Editor' or the 'Search Field' to query and find a specific charts:

When a user clicks on the 'Advanced Search Editor' a pop up will appear:

The 'Advanced Search Editor' will reflect the previous sort and filter options discussed from the upper left side of the 'All Existing Charts' Widget. It also provides users the ability to add on and build their query in the pop-up window. Users can choose from a variety of ordering and sorting options, such as ascending or descending, and utilize additional options and class options to effectively search for charts.
The 'Search Field' allows users to type in their query for a specific type of chart or clear their query here:

Users can also easily browse through their charts by paging on the lower left corner and select the number of charts they prefer to display in this widget with the 'Tiles per Page' dropdown on the lower right corner.
Additionally, users may save their layouts on their Charts Dashboard. When a change is made on the dashboard, the 'Save Dashboard Layout' option will appear.

Modifying Charts from a Chart Card in the All Existing Charts Widget

- Edit Entity

Clicking on the 'Edit Entity' icon will open a pop-up that enables users to modify the root entity of the chart, known as the Chart's root entity. This feature allows users to edit fields such as the root entity's name, number, description, and labels. It's important to note

- Refresh Image

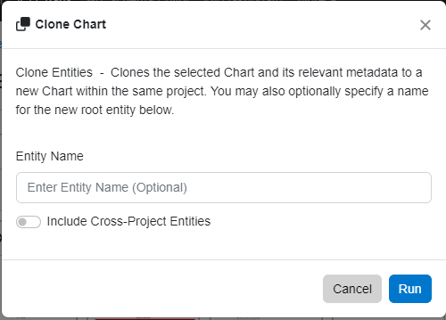
- Clone Chart

- Delete

Users can choose to delete a chart card by clicking on the 'Delete Chart' icon. It's important to understand that despite the label saying 'Delete Chart,' the action does not erase the actual chart data. Instead, it removes the chart card from the 'All Existing Charts' widget, detaching the chart's label from the root entity. Any personal preferences and customizations made to the chart, such as layout, colors, and displayed levels, will also be deleted. A confirmation prompt will appear to confirm the removal of the chart card. It's worth noting that while the chart card is removed, the chart data itself remains intact.

⚠️Since this option does not actually delete the entities, you can always re-add the appropriate label to the Root Entity to make the Chart reappear in the 'All Existing Widget'. For example, add the 'Kanban Board' label back to the desired Root Task Entity.
- Reports

Innoslate users can export a PNG of the Chart's thumbnail image or an XML or INNO of the whole chart from the 'Reports' button of a Chart Card.
Chart Cards
To learn about the individual Chart Card that is not in the 'All Existing' widget, please see this article.
Create a Chart
To create a new Chart, users can follow the steps outlined below from the Charts Dashboard.
1) Navigate to the Charts Dashboard.

2) Select Create Chart.

This button is actually 2 buttons (both are squared off in the image below), there is a main button that is the long rectangle and will start a new root entity (the root entity is also known as the parent entity of the chart) this is the defaulted option. The second button is the arrow dropdown and gives users the options to start a new chart or start one with an already existing entity as the chart's root entity.

3) Choose the desired Chart Type.

4) Give the Chart's Root Entity a Name (mandatory), Number and Description.

4) Select 'Finish' to be navigated to your new Chart.