
Innoslate’s Presentation View provides a powerful and intuitive way to create and deliver visual presentations directly within your project environment. This feature was designed to simplify the process of building presentations by allowing users to seamlessly include elements, diagrams, and documents from their existing project—eliminating the need for manual extraction or duplication. With Innoslate’s synchronization capabilities, these presentations are always up to date, reflecting the latest project data in real-time.
The Presentation View is packed with features to enhance its functionality and streamline the presentation process:
- Versatile Visuals: Users can incorporate a variety of content formats, including tables, diagrams, and charts, to create compelling and effective presentations.
- Real-Time Updates: The Presentation View ensures all included material automatically reflects changes made within the project, keeping presentations accurate and current.
- Customizable Layouts: Tailor presentations to specific needs by adjusting layouts, selecting which elements to display, and controlling the level of detail shown.
- Interactive Navigation: Navigate through presentation content, with options to expand into diagrams, filter information, and link back to source documents for deeper context.
These unique features make the Presentation View a revolutionary tool for creating and managing stakeholder-ready presentations directly within Innoslate.
Add Entities:

All of the the class entities in your schema are available for creating new and adding existing entities under the same document format. This allows users to combine various diagrams and documentation into one view. If there are schema extensions to customized projects, those added classes will also be available.
New:
The “New” tab in the Presentation View provides a comprehensive toolkit for building and enhancing your presentations. Each section within the tab is designed to streamline the process of adding content and organizing your presentation canvas efficiently.
Templates
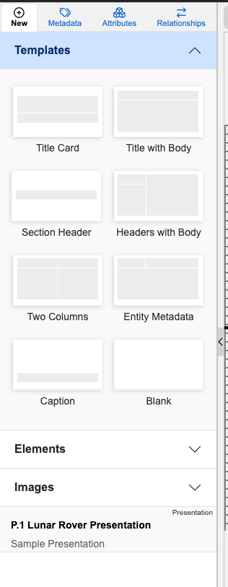
The Templates section offers a variety of predefined layouts to help you quickly structure your slides. Options include:
- Title Card: A layout dedicated to creating a clear and professional title slide.
- Title with Body: Combines a slide title with space for detailed content.
- Section Header: Perfect for transitioning between different sections of your presentation.
- Headers with Body: Includes headers paired with supporting text or visuals.
- Two Columns: Ideal for side-by-side comparisons or dual-content displays.
- Caption: Focused on adding descriptive text below images or diagrams.
- Blank: A clean slate for blank slide.
- Entity Metadata: Displays Name, Number and Description information for the selected entity directly within your presentation. The format on this slide is as follows:

Elements
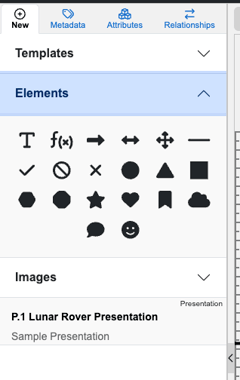
The Elements section allows users to add various interactive and visual elements to their slides.These elements help create visually engaging and meaningful presentations. Elements include:
- T: Add a text box for inserting titles, descriptions, or annotations.
- f(x): Use the equation builder for mathematical or formulaic representations (in LaTeX).
- One Sided Arrow
- Two Direction Arrow
- Four Direction Arrow
- Line
- Checkmark
- Circle-Backlash
- X
- Circle
- Triangle
- Square
- Hexagon
- Octagon
- Star
- Heart
- Bookmark
- Cloud
- Speech Bubble
- Smiley Face
Images
The Images section provides an easy way to add visual content to your presentation.

For images, users can:
- Upload Images: Drag and drop or click to upload images directly from your device.
- Remove Upload: Users can click on previously used image content and "remove upload" to save presentation file space.
- Select Image Types.
- Charts
- Compilations
- Diagrams
- Documents
- DoDAF Products
- Presentations
- Test Suites
- UAF Views
This flexibility ensures your presentations are enriched with relevant visuals and project data.
Metadata | Attributes | Relationships:
The Metadata, Attributes, and Relationships sections provide users with powerful tools to manage, describe, and connect various entities within their presentations. These sections enable efficient organization, detailed customization, and meaningful relationships between elements in your project.
Metadata
The Metadata section provides key information about the selected entity. It includes:
- Global ID: A unique identifier for the entity, ensuring traceability and easy referencing.
- ID and Class: Identifies the specific ID number and the class to which the entity belongs.
- Modification and Creation History: Displays timestamps and user details for when the entity was created or last modified.
- Labels: List of predefined or custom tags that can be applied to the entity for categorization and filtering.

The Metadata section helps users quickly assess and manage the foundational information of an entity.
Attributes
The Attributes section allows users to define additional descriptive details for the Artifact entity. Key fields include:
- Number: The numerical identifier for the entity, typically used for ordering or referencing.
- Name: The title or name of the entity. For example, “Lunar Rover Prototype Sample Introduction.”
- Description: Rich text editor field where users can provide a detailed explanation or notes about the entity. This editor supports formatting for better readability.
- Date Published: A field to specify when the entity was officially published or finalized.
- File Upload: Allows users to attach files, such as supporting documents or images, to the entity for additional context.
This section gives users the flexibility to document and customize their entities with relevant data.
Relationships
The Relationships section is a powerful tool for defining how an entity connects to other entities within the project. Features include:
- A drop down menu to scope to all, pinned, and active relationships.
- The ability to Add relationships to entities such as “defines”, “enables”, “satisfies”, and more.
- Detailed decomposition options (e.g., “decomposed by Children” or “decomposes Parents”) for creating hierarchies or dependencies.
- Direct navigation to related entities or documents for deeper exploration.

Slides:
The Slides section in the Presentation View provides a streamlined way to manage your presentation with key features designed for organization and flexibility. Each slide is displayed with a visual preview, making it easy to identify content at a glance. The preview includes the slide numbers for quick reference, alongside a thumbnail view of each slide’s content, ensuring users can locate specific slides quickly and efficiently. This visual organization simplifies navigation, allowing users to click on any slide to edit it directly or move seamlessly between slides.
In addition to its preview functionality, the Slides section supports real-time synchronization, ensuring that updates to diagrams, data, or text are automatically reflected in the slides, keeping the presentation accurate and current. Users can also easily reorder slides using a drag-and-drop interface, enabling them to adjust the sequence based on specific presentation needs or audience requirements. These features make the Slides section an essential tool for creating polished, dynamic, and adaptable presentations.

Comprehensive View

The main canvas in the Presentation View is the central workspace for designing, customizing, and finalizing slides. At the top, the toolbar provides quick access to key tools like Add New Slide, which allows users to create new slides using templates or a blank layout. Options such as Open Presentation and Open Slide streamline access to existing presentations or specific slides, while the Reports button supports exporting and analysis. The Remove Slide option simplifies slide management by enabling quick deletions.
The canvas itself offers a highly interactive space for building slides. With drag-and-drop functionality, users can easily position text, images, diagrams, and shapes, while the dynamic layout allows resizing and aligning elements for a polished look. Updates are reflected in real time, ensuring immediate feedback as users work. Additional customization options, like background images or colors, help enhance the overall visual appeal.
At the bottom, the Notes Section provides space for speaker notes or supplemental information. Users can quickly jot down talking points or context without cluttering the slide. The notes are also collaboration-friendly, allowing teammates to stay aligned on the presentation’s message. Together, the toolbar, canvas, and notes section make the Presentation View an efficient and flexible tool for creating impactful presentations.
Tutorial Video
To continue learning about Presentation View, Click Here.
(Next Article: Presentation View Navigation)