
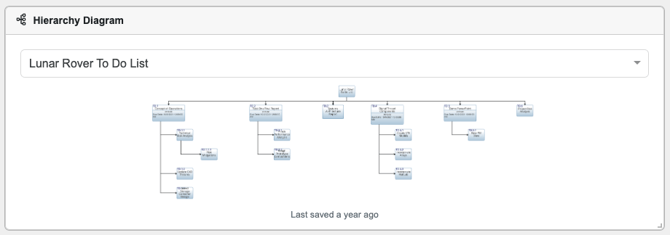
The 'Hierarchy Diagram' Widget visually represents relationships in a hierarchical structure, such as the breakdown of a project into subtasks or the organization of a team into roles and responsibilities. It provides a clear and intuitive depiction of complex structures, helping you understand and navigate the relationships and dependencies within your project.
Adding a ‘Board Progress’ Chart Widget
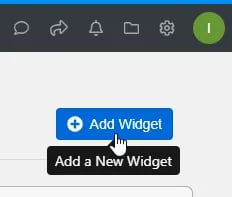
1. From your Project Management Dashboard, click the ‘ Add Widget’ button.
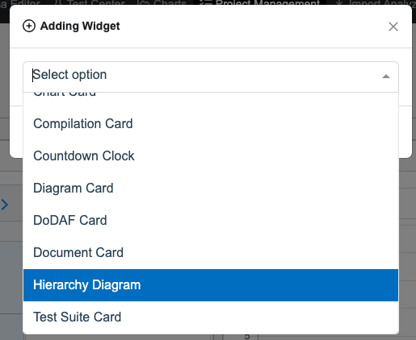
2. The ‘Adding Widget’ modal will appear. Select ‘Hierarchy Diagram’.
After adding the widget, you are able to toggle through and change the target Kanban Board to create a Board Progress Overview.
3. Click on the dropdown at the top of the widget.

Widget Options
![]()
- Lock Widget
- Close